Present Key Milestones with a Horizontal Timeline V3

Product Description
Keeping everyone aligned on project timelines can often feel like herding cats. As a program manager, you need a way to visually represent key milestones to ensure that every team member is on the same page regarding progress and deliverables.
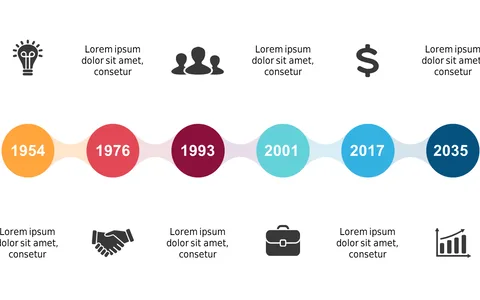
This slide effectively addresses that need with a vibrant horizontal timeline that clearly displays important dates and achievements. This slide is perfect for program managers leading cross-functional teams or project coordinators in tech firms presenting updates during weekly status meetings. You can use it in client strategy sessions to showcase development timelines or during internal reviews to keep your team focused on upcoming milestones.
For just $0.99, you can download this slide and have it ready in minutes. It’s easily editable in both PowerPoint and Google Slides, allowing you to customize it to suit your specific project needs.
$0.99 – Purchase Checkout
Added to cart