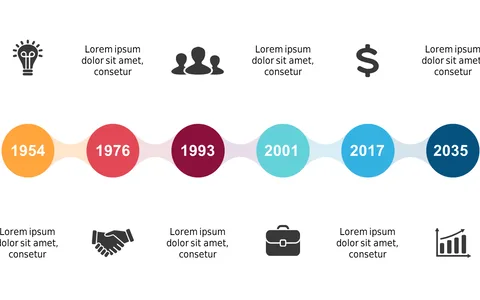
Showcase Chronological Milestones with Timeline
Product Description
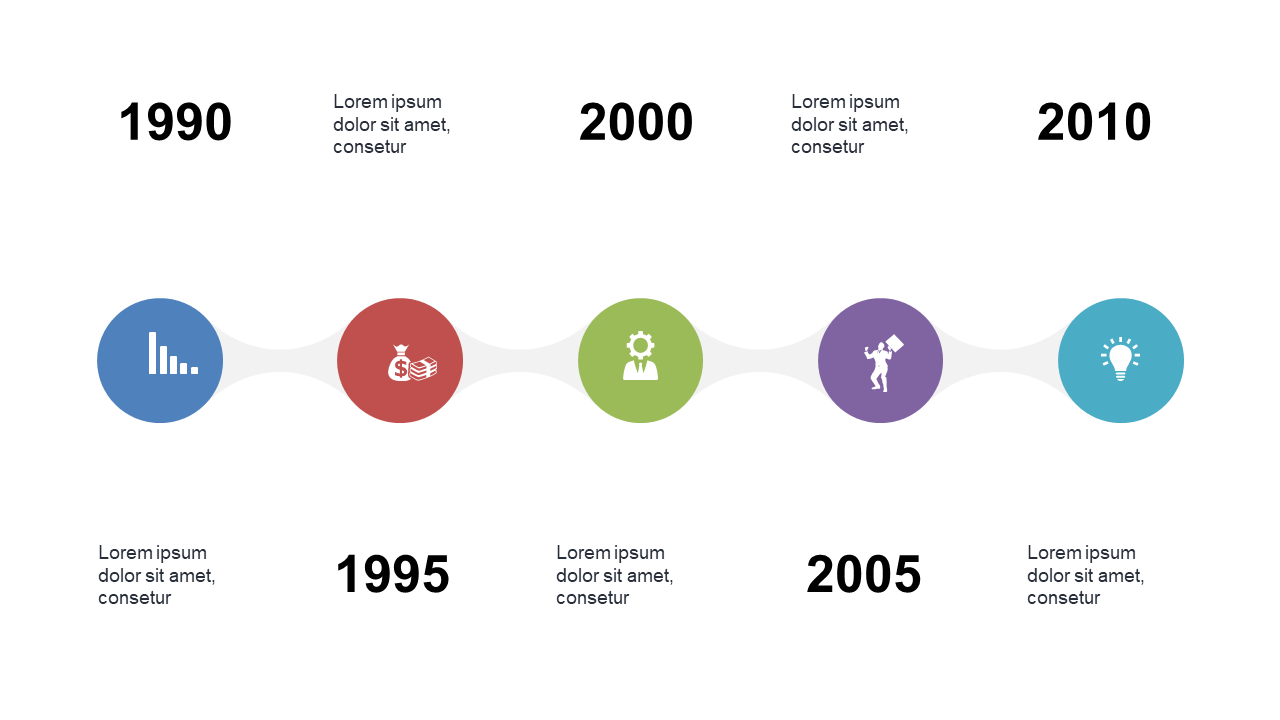
When time is tight and clarity is crucial, you need a timeline that quickly conveys essential milestones without overwhelming your audience. This slide does exactly that by visually mapping out a chronological progression of events, ensuring that your listeners can easily follow along with your key points.
Its straightforward design keeps the focus on your message. Consider using this slide for a product manager running a launch briefing, a consultant sharing case study milestones, or a team leader summarizing project timelines during a sprint review. It fits seamlessly into industries from technology to finance, helping you present critical information in a way that resonates with your audience.
For only $0.99, you can download this slide instantly. It’s fully editable in PowerPoint and Google Slides, making customization quick and simple to reflect your unique timeline of events.
$0.99 – Purchase Checkout
Added to cart