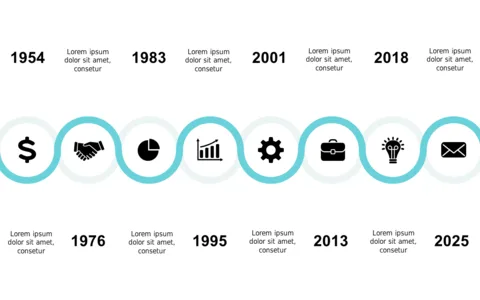
Highlight Progress with Horizontal Timeline

Product Description
Tracking progress is vital for any project, yet delivering that information clearly can often be a challenge. This horizontal timeline slide presents your key milestones in a visually appealing format, using circular indicators that enhance clarity and engagement.
Imagine using this slide as a project manager during a progress meeting with your team, or as a sales director looking to highlight quarterly achievements to upper management. It’s also valuable for HR professionals outlining training timelines or development programs.
For just $0.99, you can download this slide instantly and customize it to fit your project in PowerPoint or Google Slides. Your presentation can be ready to go in just minutes.
$0.99 – Purchase Checkout
Added to cart