Track Progress with Editable Milestone Timeline

Product Description
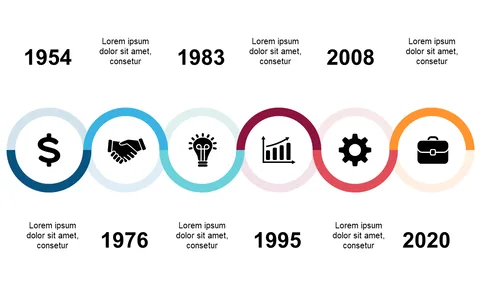
Tracking project milestones can be tricky, especially when you need to communicate updates to your team or stakeholders. This clear timeline slide visually presents your milestones, helping to highlight progress with easily recognizable icons and dates.
Business analysts or team leaders across various industries will find this slide useful during progress meetings or performance assessments. It’s an excellent choice for anyone needing to convey important project updates in a way that’s both informative and visually appealing.
For just $0.99, this slide is ready for instant download and can be easily customized in PowerPoint or Google Slides. Modify the icons and text to fit your project and present your progress with clarity.
$0.99 – Purchase Checkout
Added to cart