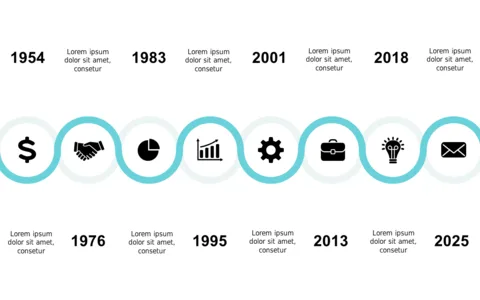
Highlight Key Years with a Circular Timeline V2

Product Description
Capturing your project’s progression while keeping your audience engaged can be a tricky balance to strike. A traditional linear timeline often fails to keep attention, while a circular format draws the eye and emphasizes key milestones effectively.
This slide provides an engaging way to present key years, making sure your audience is captivated by the narrative of your achievements. This layout is ideal for product managers presenting development timelines, sales teams discussing quarterly goals, or event planners mapping out a schedule of events. You’ll find this tool invaluable in meetings where clarity and engagement are essential, helping you leave a lasting impression on your audience.
At just $0.99, this slide is available for immediate download and can be easily customized in PowerPoint or Google Slides. Make your presentations pop with this eye-catching design, and complete your project in no time.
$0.99 – Purchase Checkout
Added to cart