Showcase Business Events with Timeline Icons V4

Product Description
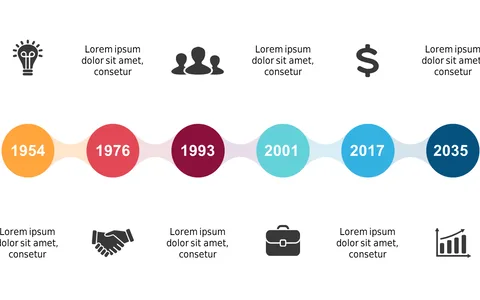
Presenting timelines effectively in PowerPoint can be a daunting task, especially when you need to capture attention while conveying essential information. A visually appealing timeline can enhance your presentation by clearly marking significant events and milestones. This slide provides a clean design with distinct icons to keep your audience engaged and informed.
Project managers, team leaders, and event coordinators will find this slide useful for showcasing project timelines during meetings or client presentations. Whether you’re outlining major project events or tracking milestones in real-time, this visual tool makes it easy for your audience to understand the timeline of events.
Available for just $0.99, this slide is ready for immediate download. It’s fully editable in PowerPoint and Google Slides, so
you can customize it effortlessly for your next presentation.
$0.99 – Purchase Checkout
Added to cart