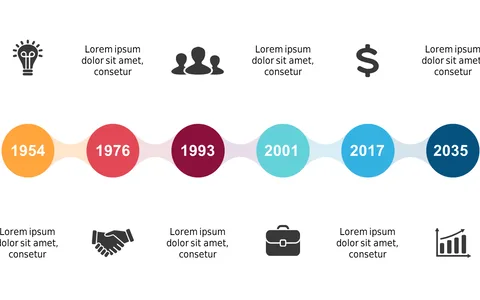
Present Project Phases with Business Timeline Icons

Product Description
Navigating through multiple project phases can be tricky when time is of the essence. A well-structured visual timeline can break down complex information into digestible bits, allowing your audience to grasp key deadlines and phases at a glance.
This slide features a professional design that ensures clarity and focus during your presentation. Program managers, product owners, and consultants will appreciate how this slide enhances their project updates and reviews. Whether you’re pitching a new project plan or providing a progress report to your team, the clear timeline and icons help convey critical information efficiently and effectively.
You can grab this slide for just $0.99 and download it instantly. It’s fully editable in PowerPoint and Google Slides, making it easy to tailor the details to fit your specific project needs.
$0.99 – Purchase Checkout
Added to cart