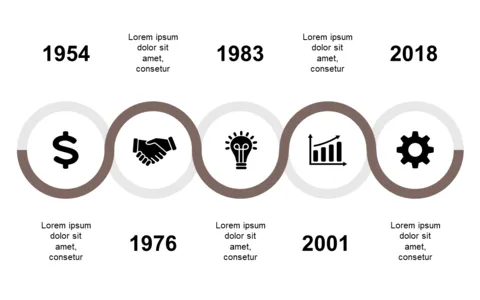
Circular Timeline for Business Milestones V2

Product Description
Tracking multiple project milestones can get complicated, especially when you’re trying to keep everyone on the same page. A traditional linear timeline might not capture all the essential points clearly, but this circular timeline simplifies understanding. It provides a visually appealing structure that highlights your project’s key moments at a glance.
This slide is perfect for project coordinators in fields like event planning or software development, especially during stakeholder meetings or project updates. Sales teams can integrate it for quarterly reviews to showcase their achievements over time.
No matter your industry, this design helps everyone keep track of progress effortlessly. At just $0.99, you can download this slide instantly and make it your own. It’s fully editable in PowerPoint and Google Slides, allowing you to tailor each milestone to your needs in mere minutes.
$0.99 – Purchase Checkout
Added to cart