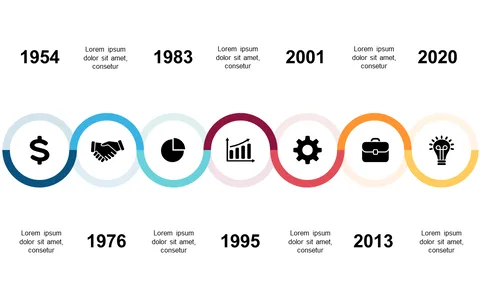
Illustrate Milestones with a Circular Timeline

Product Description
When projects progress, you need a way to present milestones that cuts through the noise. Relying on traditional timelines can leave your audience confused, but a circular design not only clarifies the timeline but also captivates attention. You’ll find that this format makes it easy to showcase achievements without overwhelming viewers with information.
Project managers in industries like technology or manufacturing will appreciate how this slide displays phases during sprint reviews or product launches. Marketing teams can also use it during campaign updates to highlight key achievements.
Whether you are presenting to your team or senior executives, this visual representation will enhance your storytelling.
For just $0.99, you can instantly download this slide, which is easy to edit in PowerPoint or Google Slides. Customize the dates and milestones with just a few clicks, and get ready to impress your audience in minutes.
$0.99 – Purchase Checkout
Added to cart