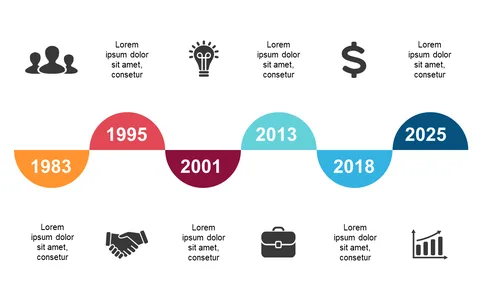
Professional Achievements Timeline with Customization

Product Description
Illustrating your team’s successes can be a challenge, especially for program managers needing to convey growth over time. This timeline slide provides a clear format for showcasing professional milestones, making it straightforward for your audience to grasp the evolution of achievements.
It’s particularly useful in team briefings or when reporting to upper management about project developments. You can also use it effectively in client meetings to demonstrate your team’s progress and milestones achieved throughout the project lifecycle.
For only $0.99, this slide is available for instant download and can be customized easily in PowerPoint or Google Slides. You’ll appreciate how quickly you can adapt it to fit your narrative and highlight your team’s accomplishments.
$0.99 – Purchase Checkout
Added to cart