Visualize Continuous Processes with Circular Diagram
Product Description
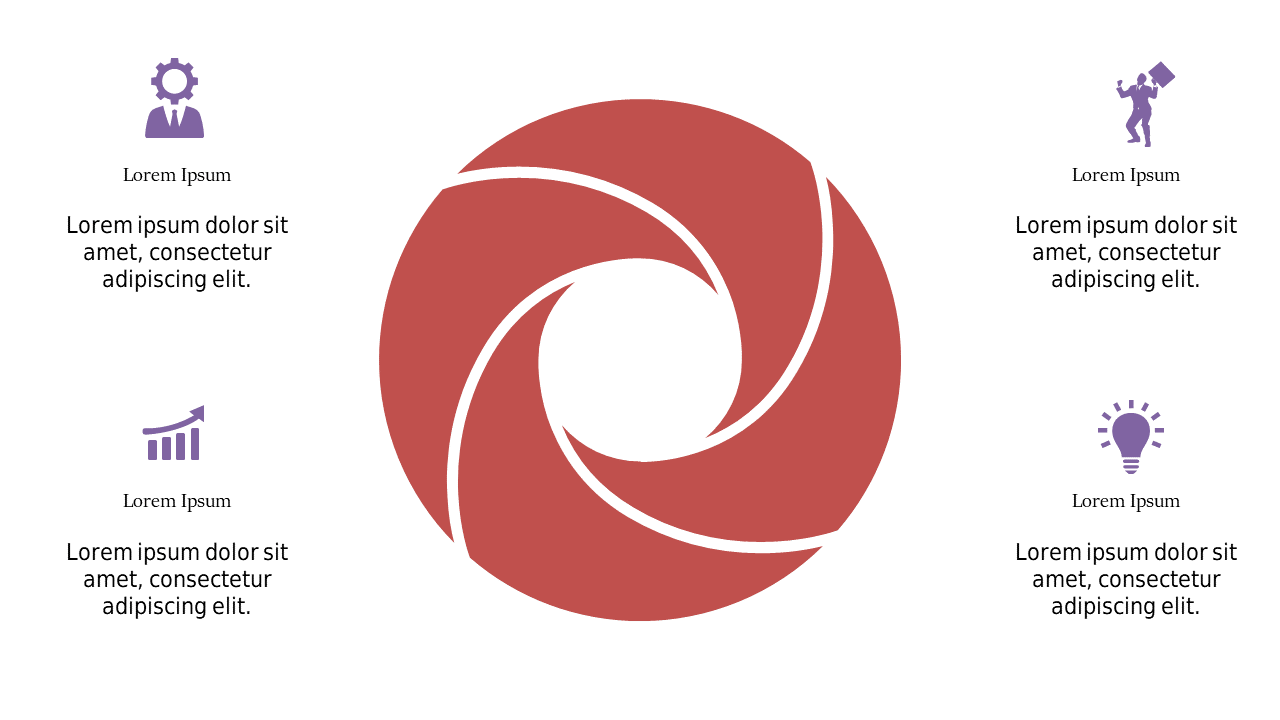
Illustrating continuous processes can often lead to confusion, leaving your audience struggling to follow along. Clarity is essential, and this circular diagram offers a straightforward way to present cyclical information that anyone can understand at a glance.
It turns complex ideas into a visual format that sticks. Project managers and operations specialists can use this slide effectively during strategy meetings or process improvement discussions. Whether you’re detailing workflows, production cycles, or any repetitive processes, this diagram provides a professional touch to ensure your points are clear and engaging.
Available for only $0.99, this slide is ready for instant download and works seamlessly in PowerPoint and Google Slides. Editing it is a breeze, so you can have it tailored to your needs in no time.
$0.99 – Purchase Checkout
Added to cart







