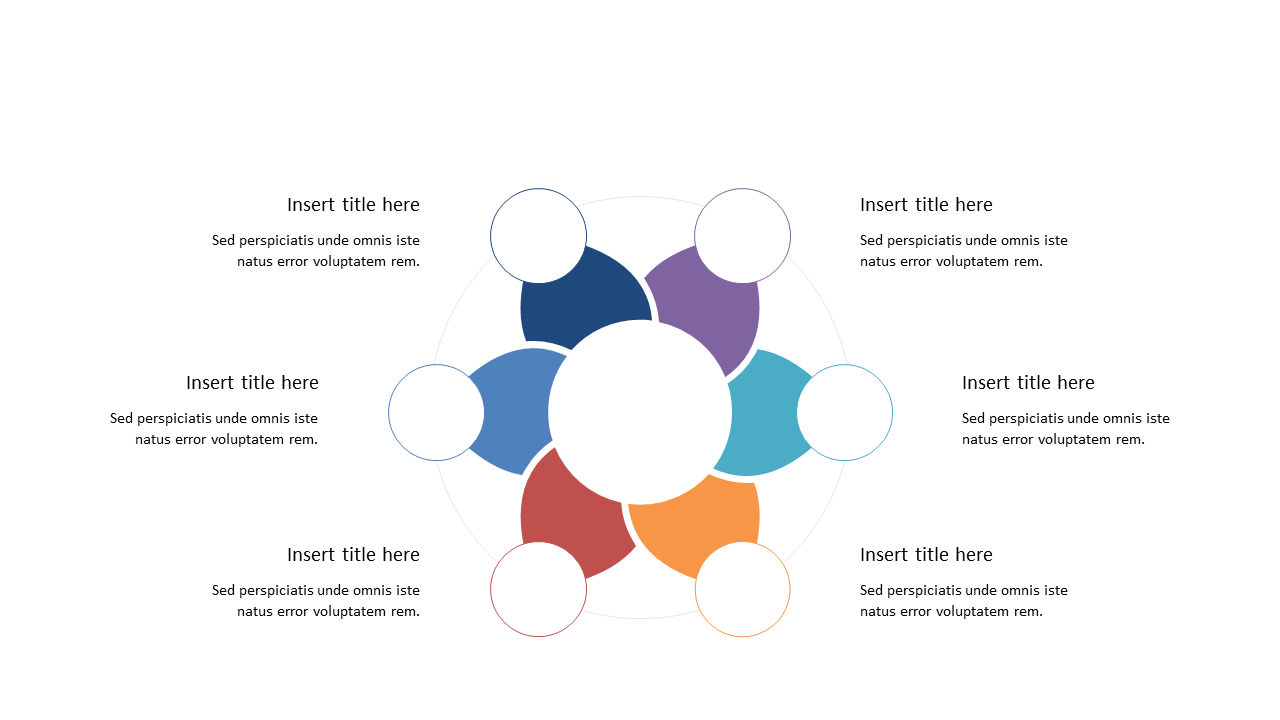
Highlight Key Elements with Circular Gear Diagram
Product Description
Communicating the dynamics of complex processes often leads to confusion if not presented clearly. This circular gear diagram simplifies that challenge, visually highlighting how different components work together in a cohesive manner.
It provides the clarity your audience needs to understand intricate workflows without overwhelming them. Imagine this slide in use by operations managers discussing supply chain processes, business analysts presenting market trends, or educators demystifying theoretical frameworks. It’s designed to fit seamlessly into any meeting where you need to explain how various aspects interrelate.
For only $0.99, you can download this engaging slide and customize it to match your specific needs. It’s easy to edit in PowerPoint and Google Slides, so you can have a professional-looking presentation ready in no time.
$0.99 – Purchase Checkout
Added to cart







