Illustrate Interconnected Processes with Gear Diagram
Product Description
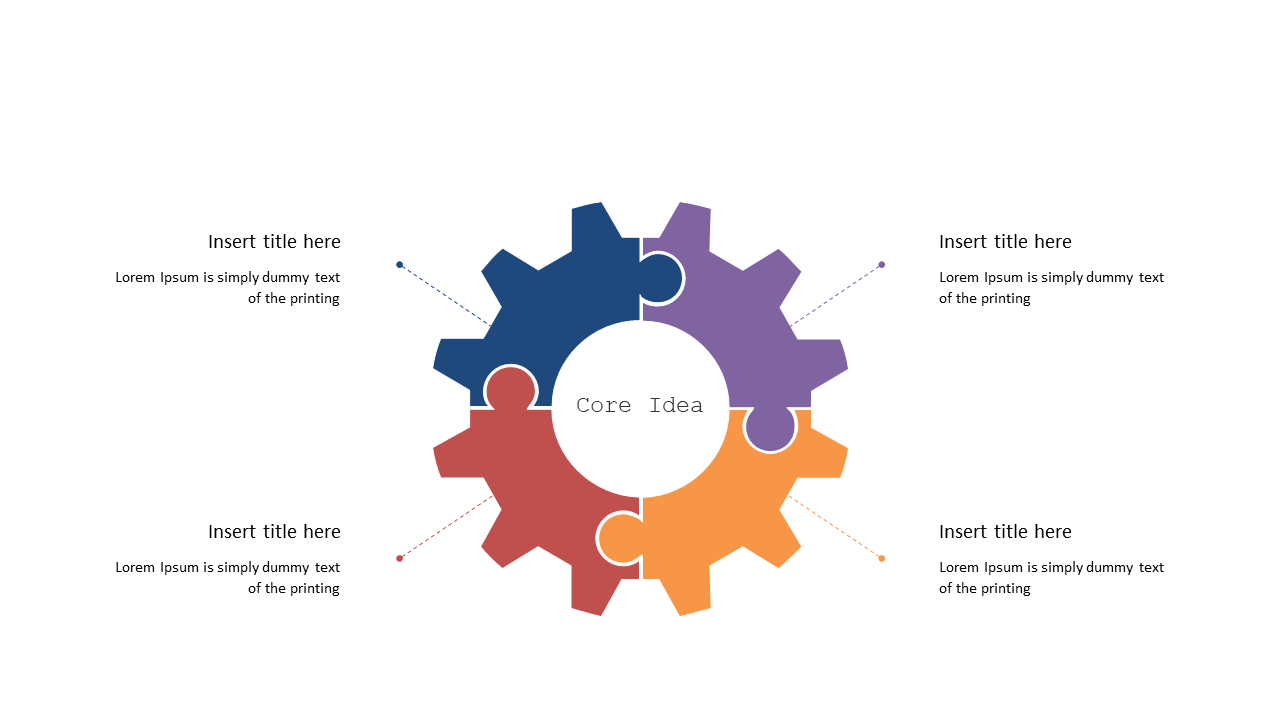
It’s often challenging to explain interconnected processes to your audience in a way that’s both clear and visually compelling. The gear diagram slide simplifies this task, providing a dynamic visual representation of multiple elements working together.
With a circular design that illustrates different segments seamlessly, it helps emphasize the relationships between each part of your process. This slide is great for operations managers detailing workflow processes, sales teams outlining their customer journey, or educators explaining complex theories in a classroom setting. By providing a structured visual, it aids in facilitating discussion about how each element connects and contributes to the overall goal.
Available for just $0.99, this slide is easy to download and customize in PowerPoint or Google Slides. You’ll be able to create an effective presentation that clarifies connections and processes in minutes.
$0.99 – Purchase Checkout
Added to cart







