Visualize Data Percentages with 3D Bar Chart
Product Description
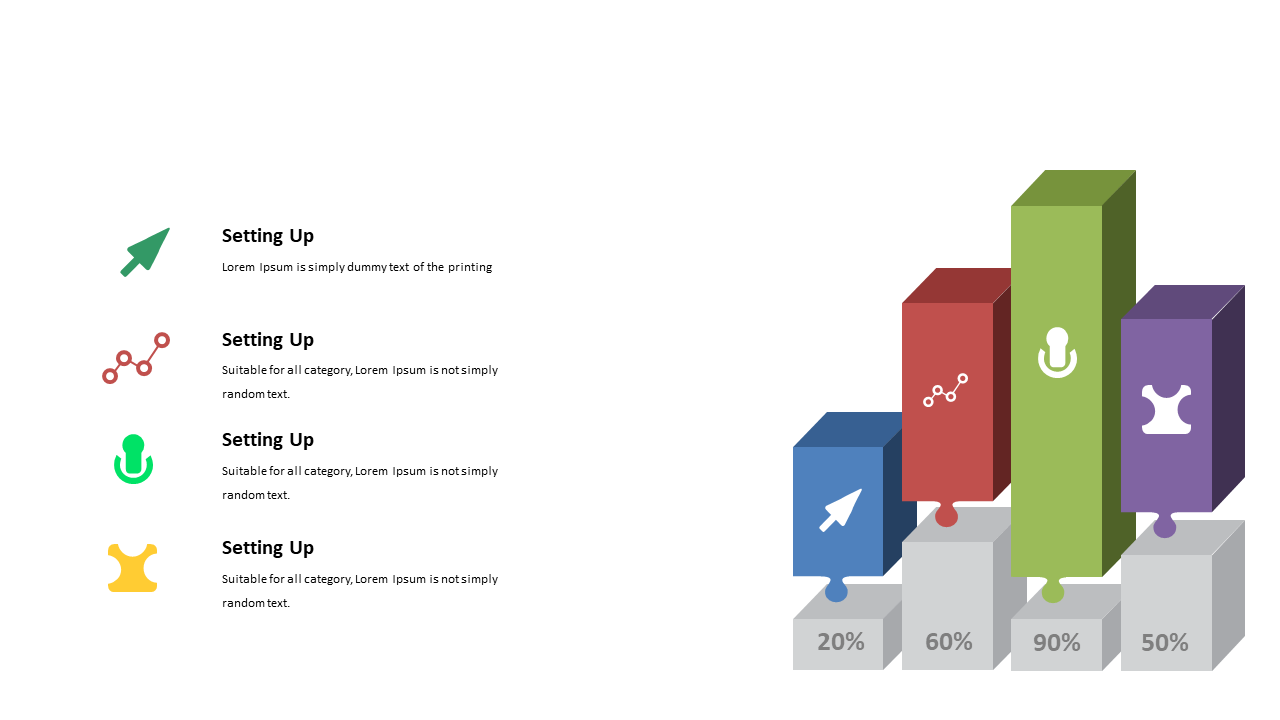
In a world where time is money, effectively communicating data can feel like an uphill battle. This vibrant 3D bar chart simplifies complex statistics into visually appealing graphics, making it easier for your audience to grasp key percentages at a glance.
The engaging design invites scrutiny without overwhelming viewers with information. This slide is perfect for analysts presenting quarterly reports, marketers comparing campaign performance, or executives sharing organizational metrics. Use it in board meetings, team updates, or sales presentations to clearly convey essential data points and foster informed decision-making among your audience.
For just $0.99, this slide can be downloaded instantly and tailored in PowerPoint or Google Slides. You’ll find it easy to input your data, and within minutes, you’ll have a polished, professional chart ready to impress your audience.
$0.99 – Purchase Checkout
Added to cart







