Track Social Media Analysis with Funnel Diagram
Product Description
Tracking social media performance can be a daunting task, especially when trying to make sense of engagement and conversion data. With so many metrics to consider, it’s easy to feel lost and overwhelmed.
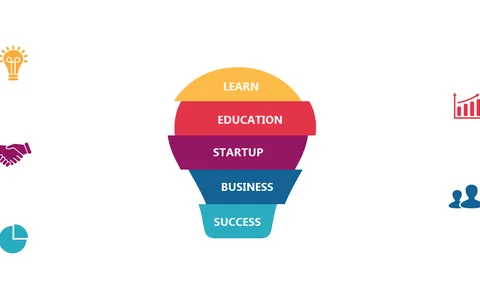
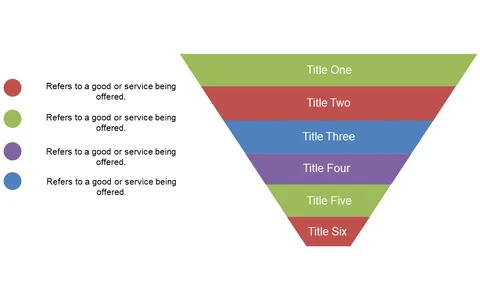
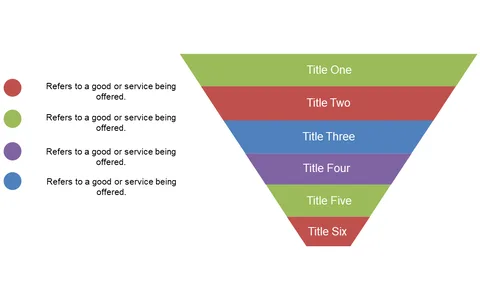
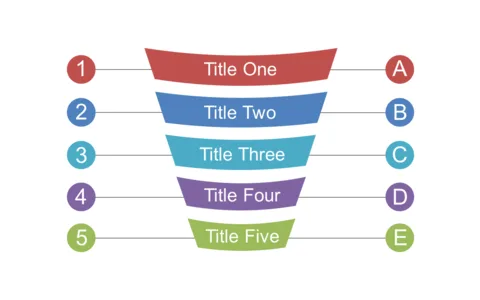
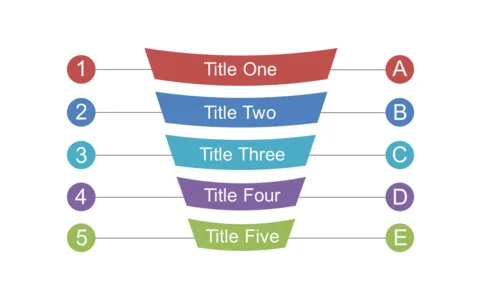
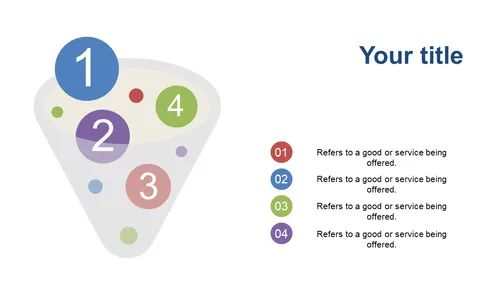
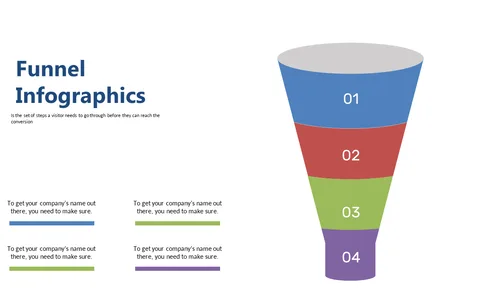
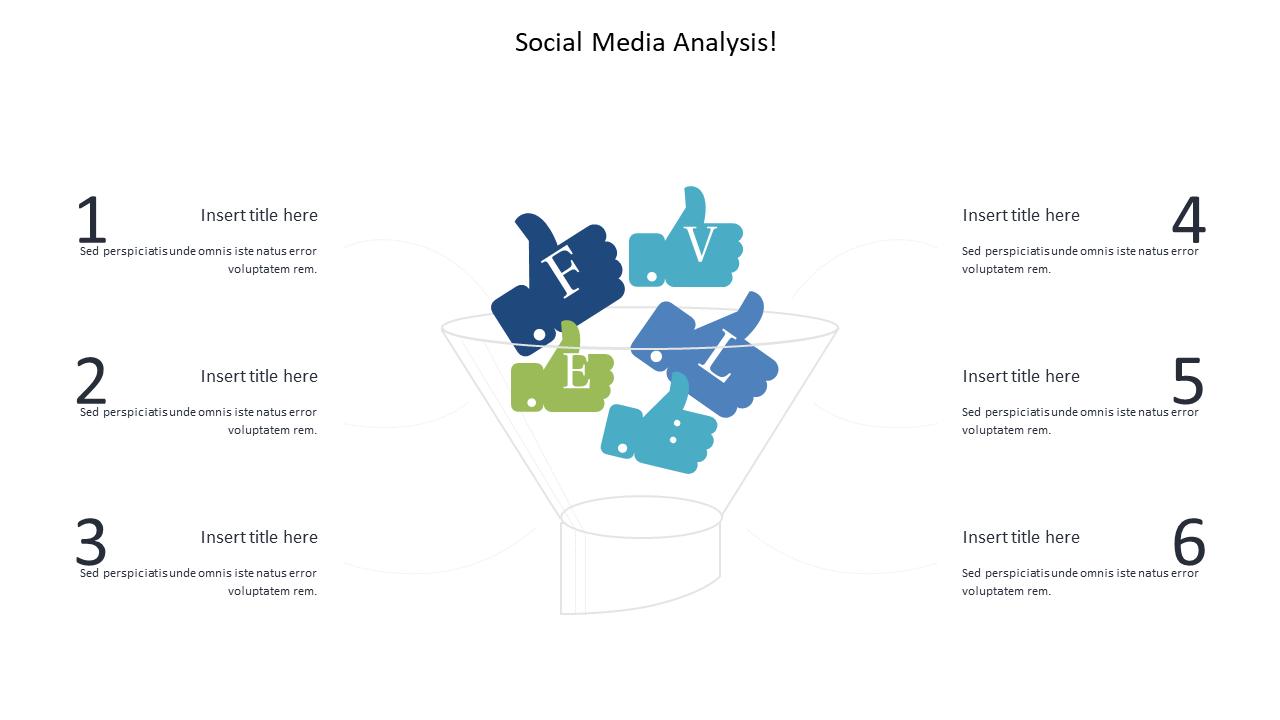
This funnel diagram breaks down the process into clear, manageable stages, helping you visualize and understand your analysis results more effectively. Marketing managers, social media strategists, and data analysts will find this slide particularly useful during performance review meetings. Whether you’re discussing campaign effectiveness in a quarterly review or presenting data to clients, this slide allows you to showcase your findings in an organized manner that everyone can grasp.
For just $0.99, you can download this slide instantly, and it’s fully editable in PowerPoint or Google Slides. You’ll be able to customize it to fit your brand and data needs in just minutes.
$0.99 – Purchase Checkout
Added to cart