Compare Social Media Engagement Metrics Visually V4
Product Description
Navigating the complexities of social media engagement can be tough, especially when trying to assess marketing effectiveness and ROI. If you need to present clear insights to your team or management, a straightforward visual can be a game changer.
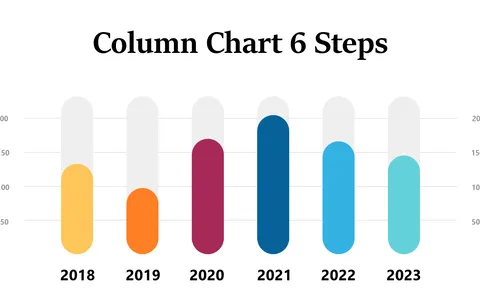
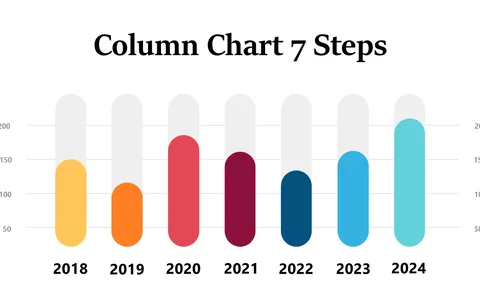
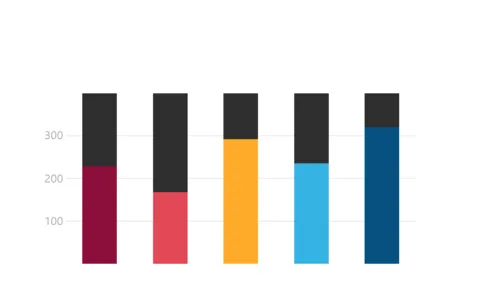
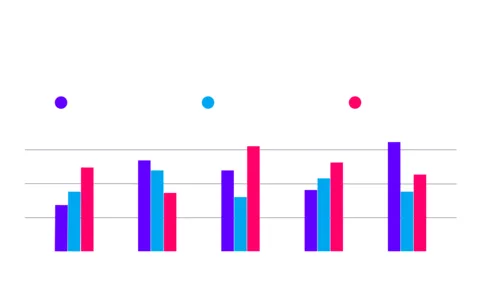
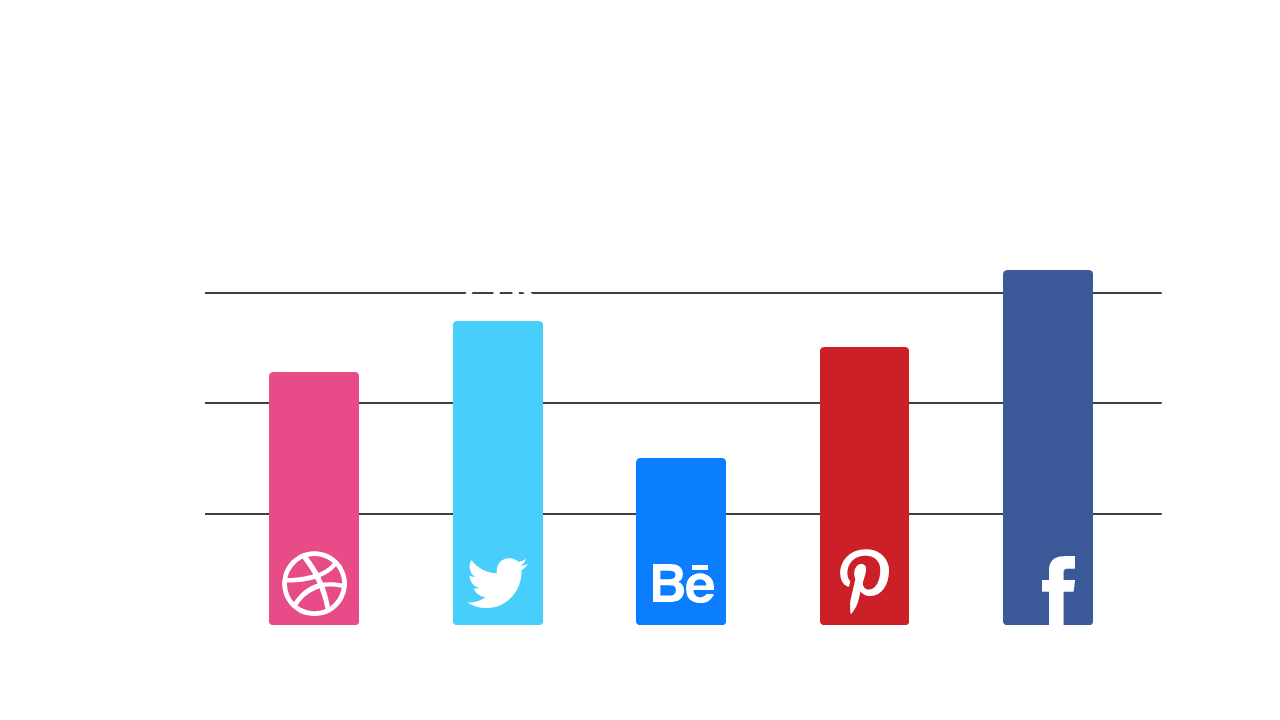
This bar chart is designed to distill essential engagement metrics into an easy-to-understand format. Finance leads, marketing analysts, and campaign managers can utilize this slide during budget reviews, strategy sessions, or performance discussions. It allows you to present factual data effectively, ensuring that everyone understands the impact of your social media efforts.
You can access this slide for just $0.99, making it an affordable tool for your presentations. It’s fully customizable in PowerPoint and Google Slides, so you can make your adjustments and be ready to present in no time.
$0.99 – Purchase Checkout
Added to cart