Compare Social Media Engagement Metrics Visually V3
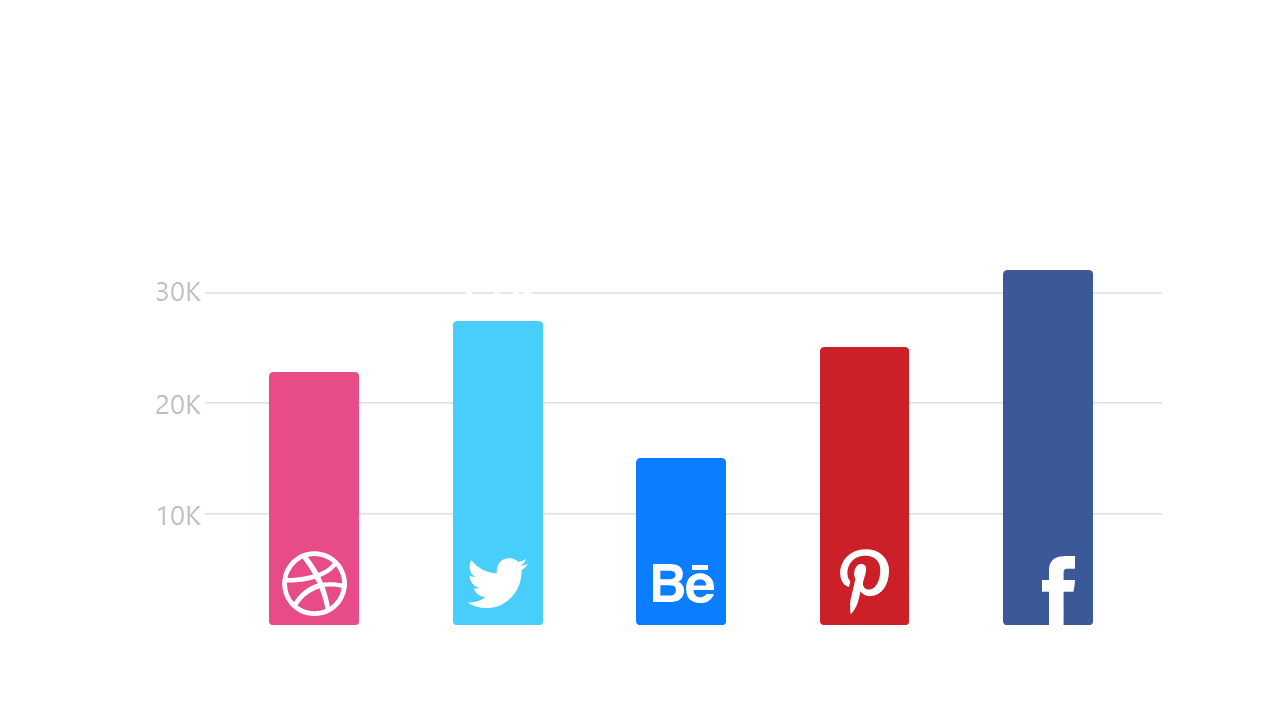
Product Description
Finding a clear way to convey your social media performance data can feel like an uphill battle. With numerous metrics to track, it’s easy to lose your audience in the details.
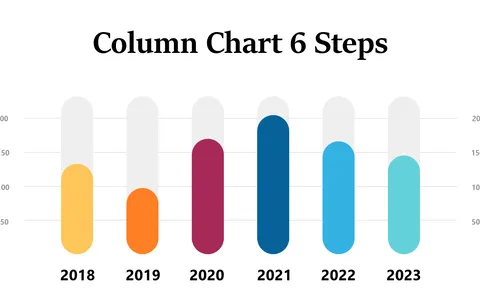
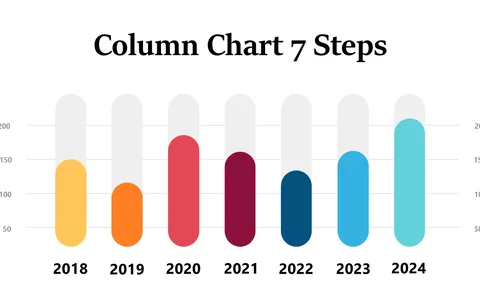
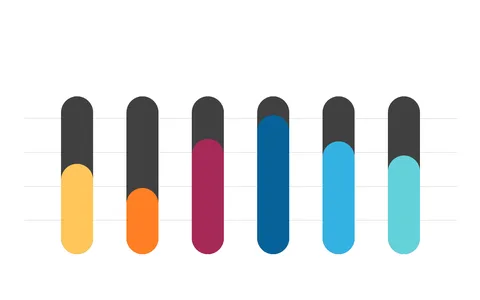
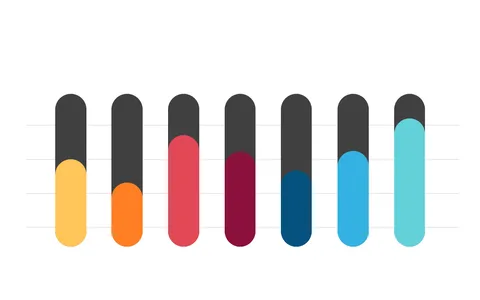
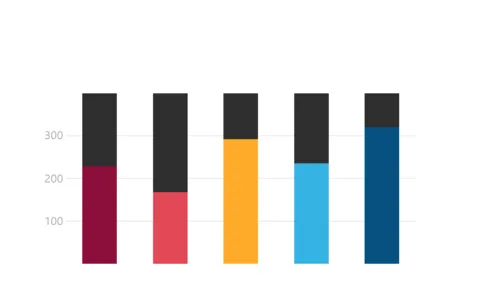
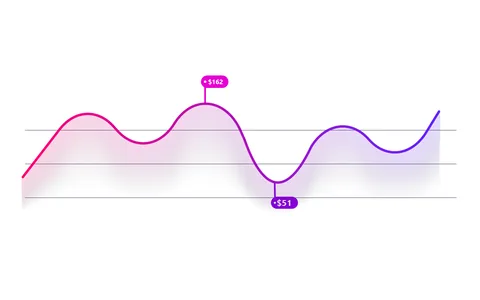
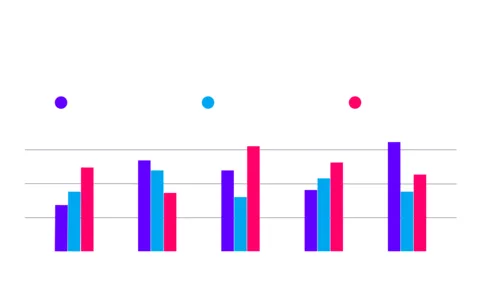
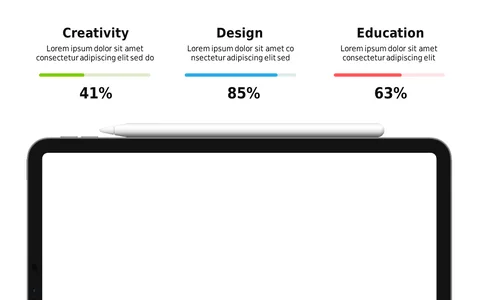
This visually engaging bar chart simplifies the process, allowing you to showcase engagement metrics across different platforms with ease. Ideal for digital marketers, social media strategists, and data analysts, this slide shines in team meetings, project updates, or performance reviews. You can present your analysis confidently, knowing your audience will grasp the key insights without getting lost in the numbers.
Available for just $0.99, this slide is a quick and easy download, ready for editing in both PowerPoint and Google Slides. You’ll have a polished presentation in minutes, so you can focus on what really matters.
$0.99 – Purchase Checkout
Added to cart