Compare Social Media Engagement Metrics Visually
Product Description
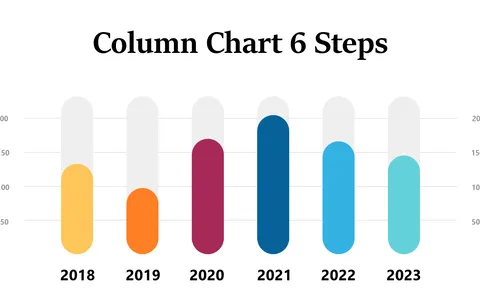
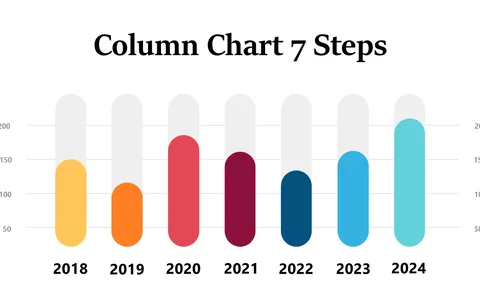
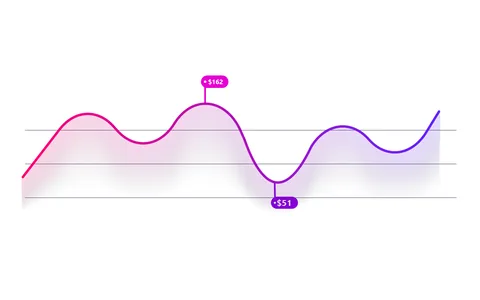
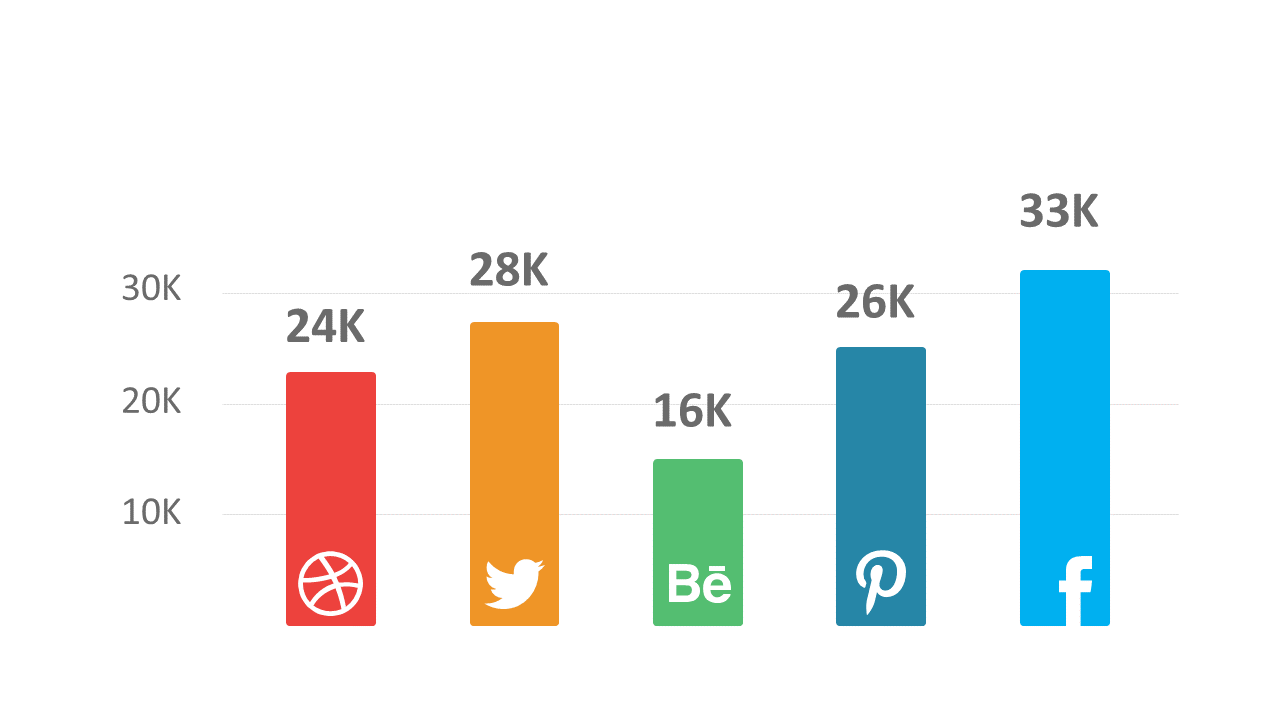
Complex data can often feel overwhelming, especially when you’re trying to share insights with your team or clients. When faced with the challenge of making social media engagement metrics understandable, a clear visual comparison can make all the difference.
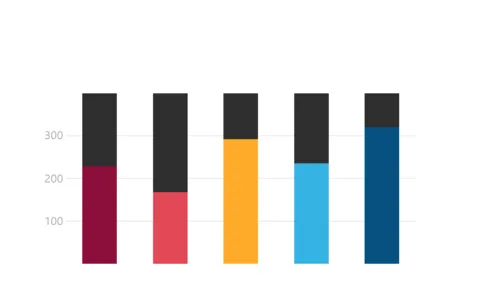
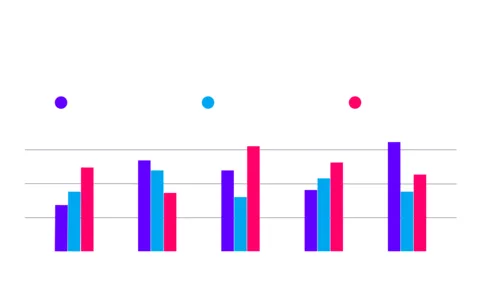
This slide helps you break down the details so that the important information stands out. Business analysts, marketers, and social media managers will find this slide indispensable when presenting performance metrics in meetings or reports. Whether you’re highlighting quarterly performance in a marketing strategy meeting or analyzing engagement for a social media campaign, this bar chart provides clarity and impact.
You can download this slide for just $0.99, and it’s quickly editable in PowerPoint or Google Slides. With its user-friendly design, you’ll be ready to impress your audience in no time.
$0.99 – Purchase Checkout
Added to cart