Customizable Maps of Denmark and Netherlands
Product Description
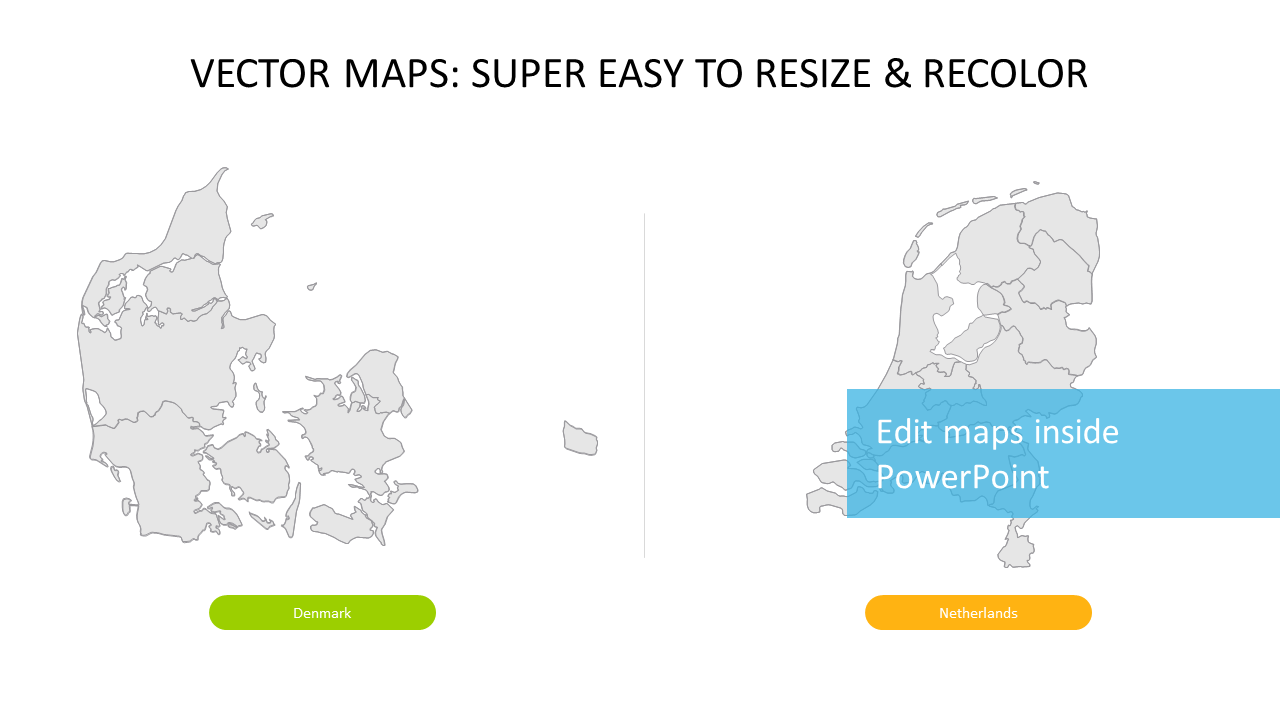
When discussing geographical data, it’s crucial to have visuals that speak clearly to your points. This slide features customizable maps of Denmark and the Netherlands, making it easier for you to present comparisons or trends in the data with precision.
Business analysts and project managers in industries like logistics or international trade can greatly benefit from this slide during presentations on regional performance or operational strategies. These maps serve perfectly in team meetings or client briefings where geographical context is essential for decision-making.
For only $0.99, you can download this slide right away and start editing it in PowerPoint or Google Slides. Customizing it to fit your presentation needs is quick and straightforward, so you can focus on delivering your message effectively.
$0.99 – Purchase Checkout
Added to cart







