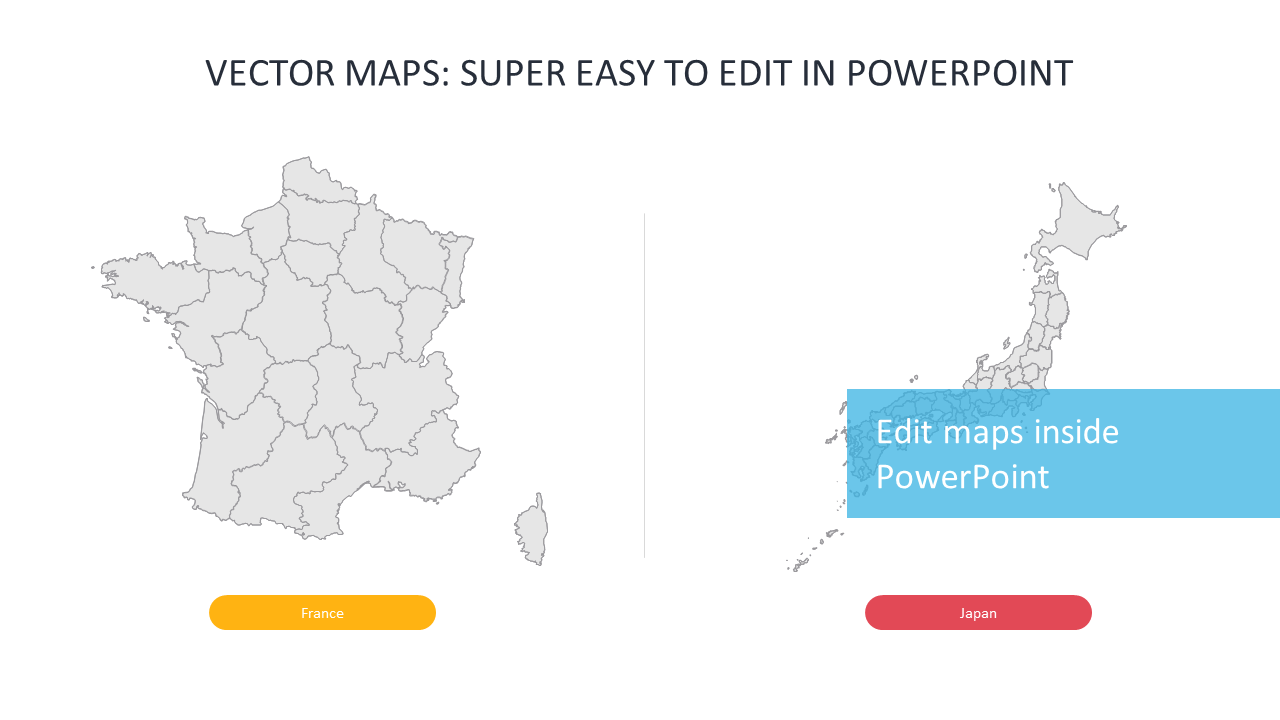
Editable Vector Maps of France and Japan
Product Description
Communicating geographical data can often feel overwhelming, especially when presenting strategies that hinge on location. By providing editable vector maps of France and Japan, this slide makes it simple to incorporate visuals that enhance your narrative.
You can highlight specific areas or trends, making it easy for your audience to follow along. This slide is ideal for business consultants preparing competitive analyses, project managers showcasing site selection, or urban planners discussing development projects. Whether you’re in a strategy meeting with clients or presenting to a board, these maps can strengthen your argument and provide visual context that resonates.
At just $0.99, this slide is ready for instant download and easy to customize. You’ll find it compatible with both PowerPoint and Google Slides, allowing you to make it your own in just minutes.
$0.99 – Purchase Checkout
Added to cart







