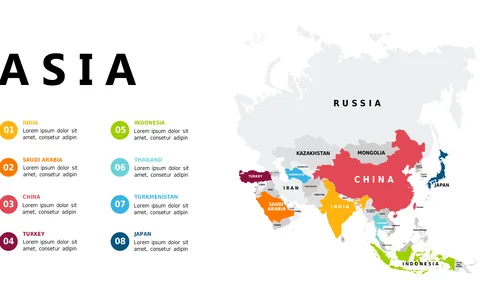
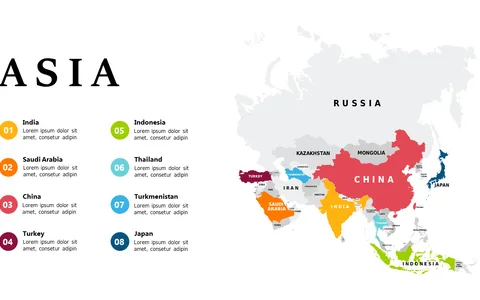
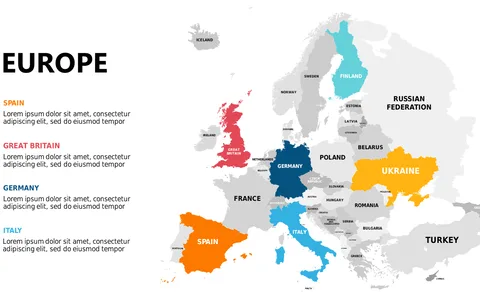
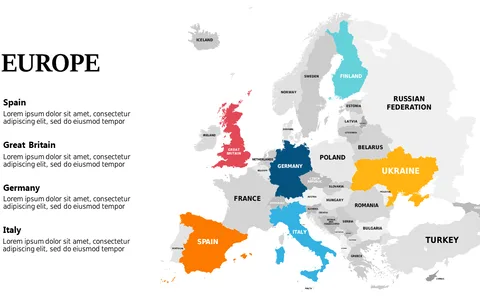
Compare Spain, Portugal, and New Zealand Maps

Product Description
Getting your point across with geographic data can be tough, especially when you need to show comparisons between countries. The side-by-side layout of the maps for Spain, Portugal, and New Zealand lets you illustrate key differences and similarities in a straightforward manner that your audience can easily digest.
The vibrant visuals grab attention, allowing complex information to be conveyed at a glance. This slide is perfect for educators teaching geography, market analysts comparing economic regions, or travel planners outlining itineraries. Whether you’re in a classroom giving a lecture, at a business meeting discussing international expansion, or preparing a report for a travel conference, this slide provides the clarity you need.
For just $0.99, you can instantly download this slide and get to work right away. It’s editable in both PowerPoint and Google Slides, so customizing it for your needs is quick and easy.
$0.99 – Purchase Checkout
Added to cart