Explore Central America with Colorful Map
Product Description
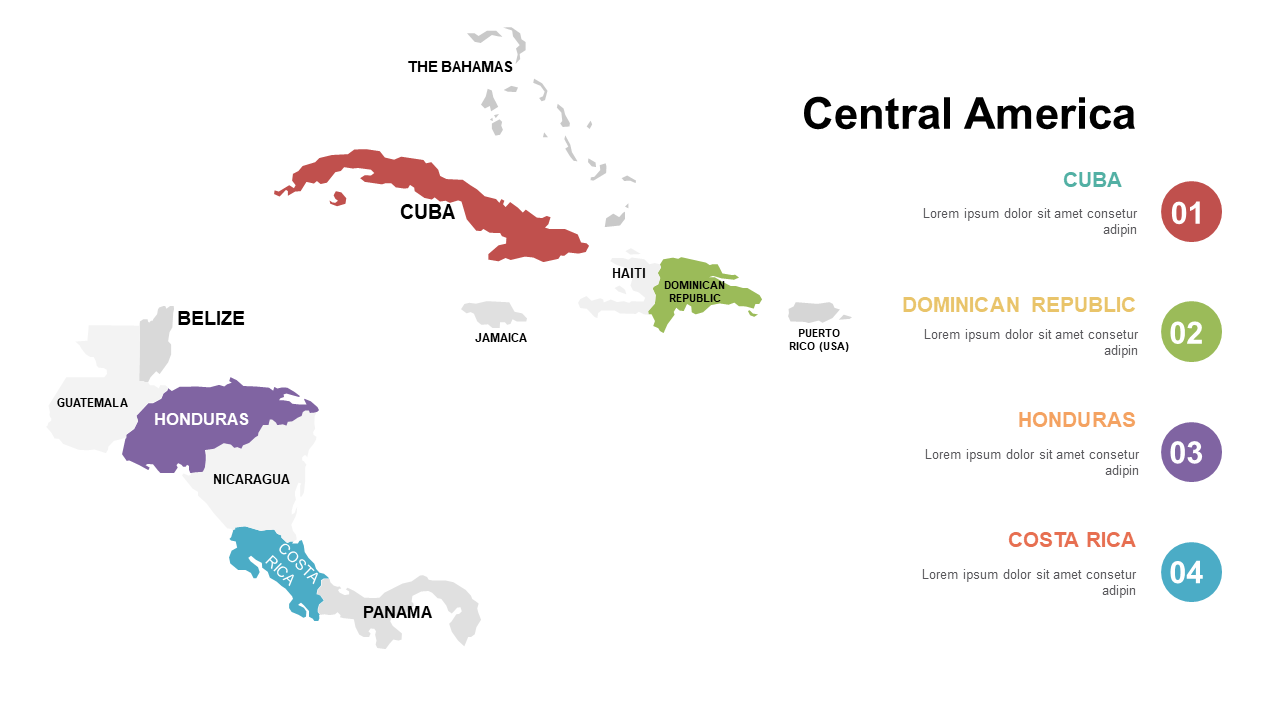
Presenting complex geographic information can be overwhelming for your audience if the visuals aren’t engaging. This colorful map of Central America simplifies that challenge by displaying clear region labels and vibrant colors, allowing your audience to quickly understand key geographical insights.
Ideal for educators, business analysts, or travel agents, this slide can support discussions about tourism, economic trends, or cultural comparisons across Central America. It’s a great way to drive home your points while keeping the audience focused and engaged.
For only $0.99, you can download this slide immediately and customize it to fit your presentation. It’s compatible with both PowerPoint and Google Slides, making it easy to tweak and tailor as needed.
$0.99 – Purchase Checkout
Added to cart







