Visualize Global Data with Dots Map
Product Description
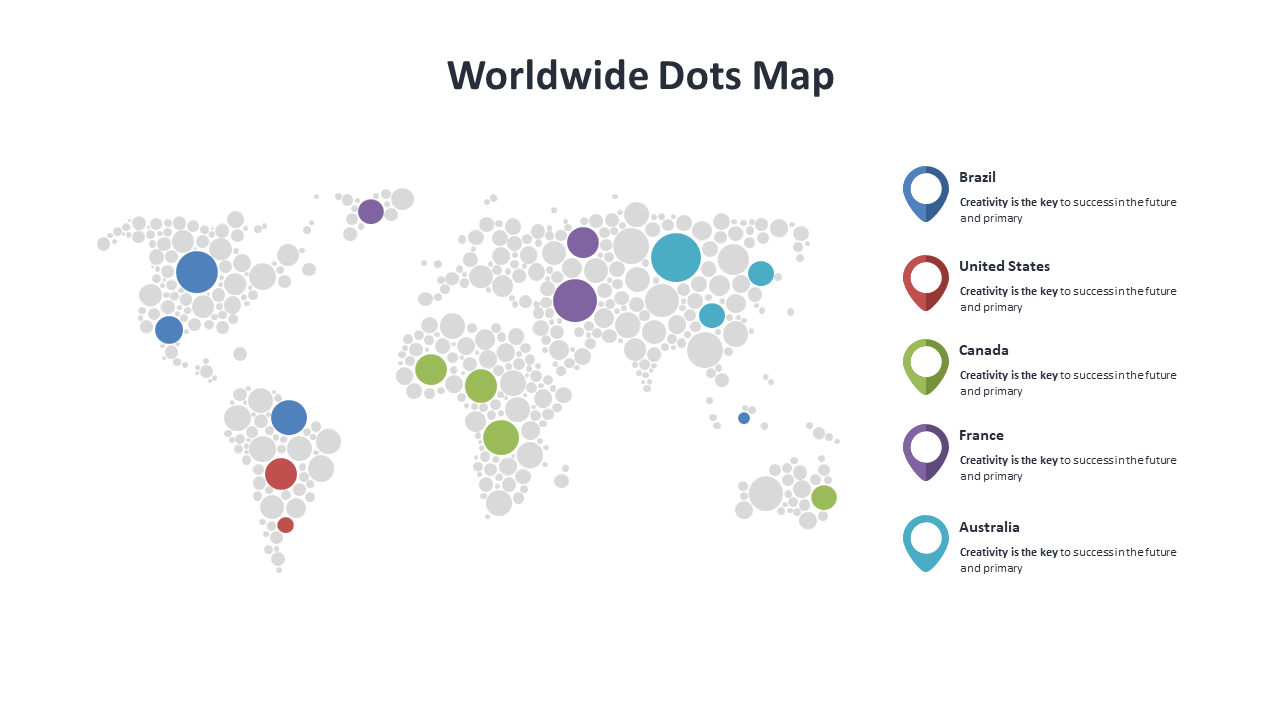
As a sales territory manager, presenting complex data can often feel daunting, especially when trying to engage your audience. A typical spreadsheet or bar chart may not capture attention as effectively as you’d like. This visually striking dots map offers a fresh perspective, allowing you to represent key metrics from various countries in a clear yet engaging way.
Perfect for sales meetings, strategic planning sessions, or market analysis presentations, this slide helps you illustrate performance metrics or market opportunities across different regions. Whether you’re sharing insights with your team or presenting to potential investors, this visual will capture their attention and enhance understanding.
You can download this informative slide for just $0.99 and
easily customize it in PowerPoint or Google Slides. Editing is quick and user-friendly, so you’ll have a compelling visual ready to support your narrative in minutes.
$0.99 – Purchase Checkout
Added to cart







