Detailed Texas County Map for Presentations
Product Description
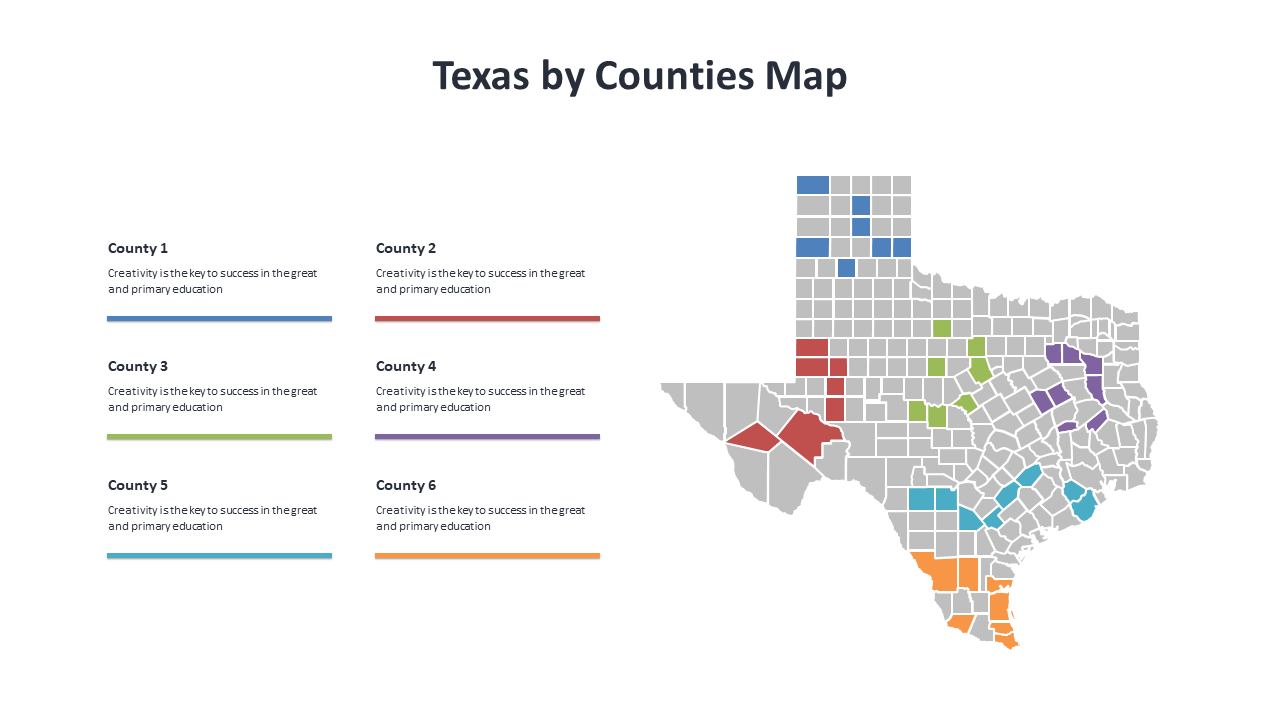
When you’re dealing with intricate details about Texas regions, trying to communicate them through text alone can lead to misunderstandings. A well-designed map offers a straightforward way to illustrate key information and helps your audience pinpoint specific areas quickly. This Texas County Map serves as the ideal visual aid for your presentations, allowing you to convey regional characteristics effectively.
Logistics managers, real estate professionals, and regional planners will find this slide particularly useful. Whether you’re discussing distribution routes, real estate trends, or local regulations, this visual representation will keep your audience engaged and informed during meetings or strategy sessions.
It’s a valuable addition for anyone needing to present geographic data clearly. Available for just $0.99, this slide is an instant download that you can edit in PowerPoint or Google Slides. The customizable features allow you to adapt colors and annotations to best fit your presentation needs, ensuring you’re set to deliver your message in just minutes.
$0.99 – Purchase Checkout
Added to cart







