Showcase Growth Trends with Vertical Bar Chart
Product Description
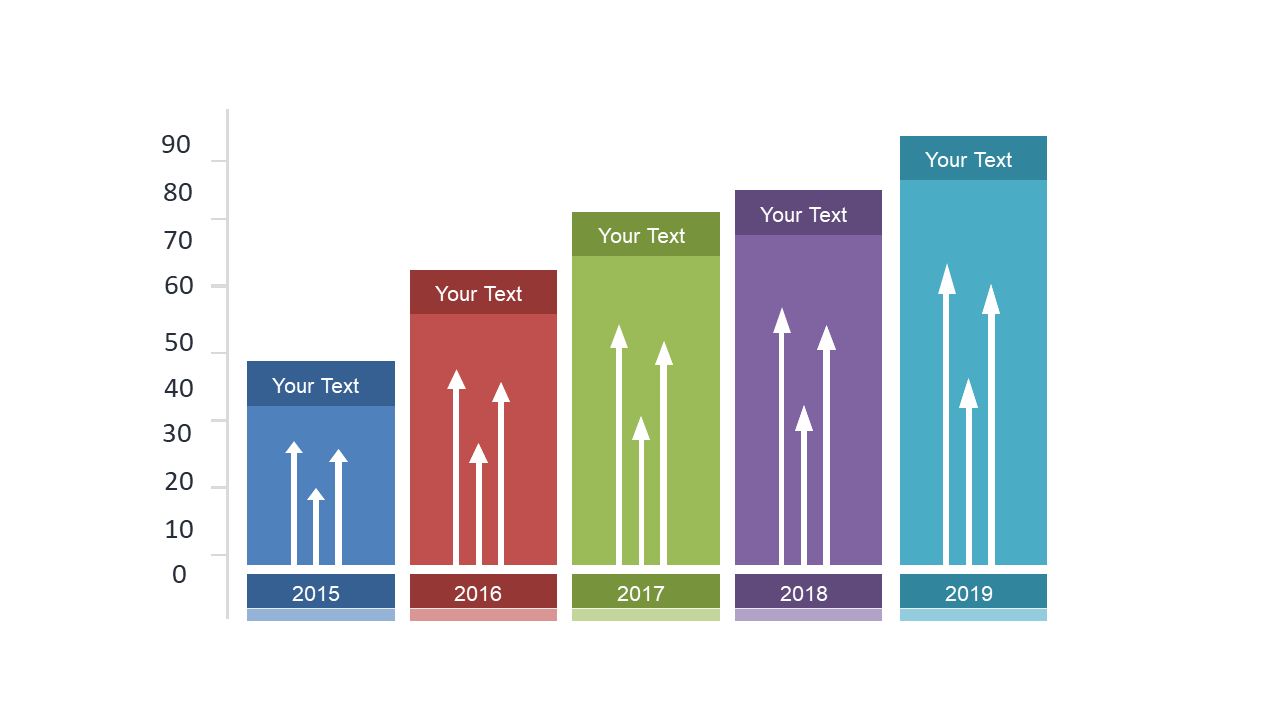
Presenting data in a compelling way can be daunting, especially when it comes to showcasing growth trends. This vertical bar chart slide provides a visually striking way to represent upward movement, helping your audience grasp important information quickly and effectively.
Perfect for financial analysts, sales directors, or marketing teams, this slide can be used in quarterly reviews, product performance presentations, or strategic planning sessions. You’ll be able to illustrate key metrics and trends that drive decision-making.
For only $0.99, this slide is ready for instant download and easy to edit in PowerPoint or Google Slides. Get started right away and present your data in a way that truly resonates with your audience.
$0.99 – Purchase Checkout
Added to cart







