Visualize Ideas with Circular 6-Step Diagram V2
Product Description
Effectively communicating a series of ideas or processes can be tricky, especially when the information is complex. You need a solution that captures the flow without overwhelming your audience.
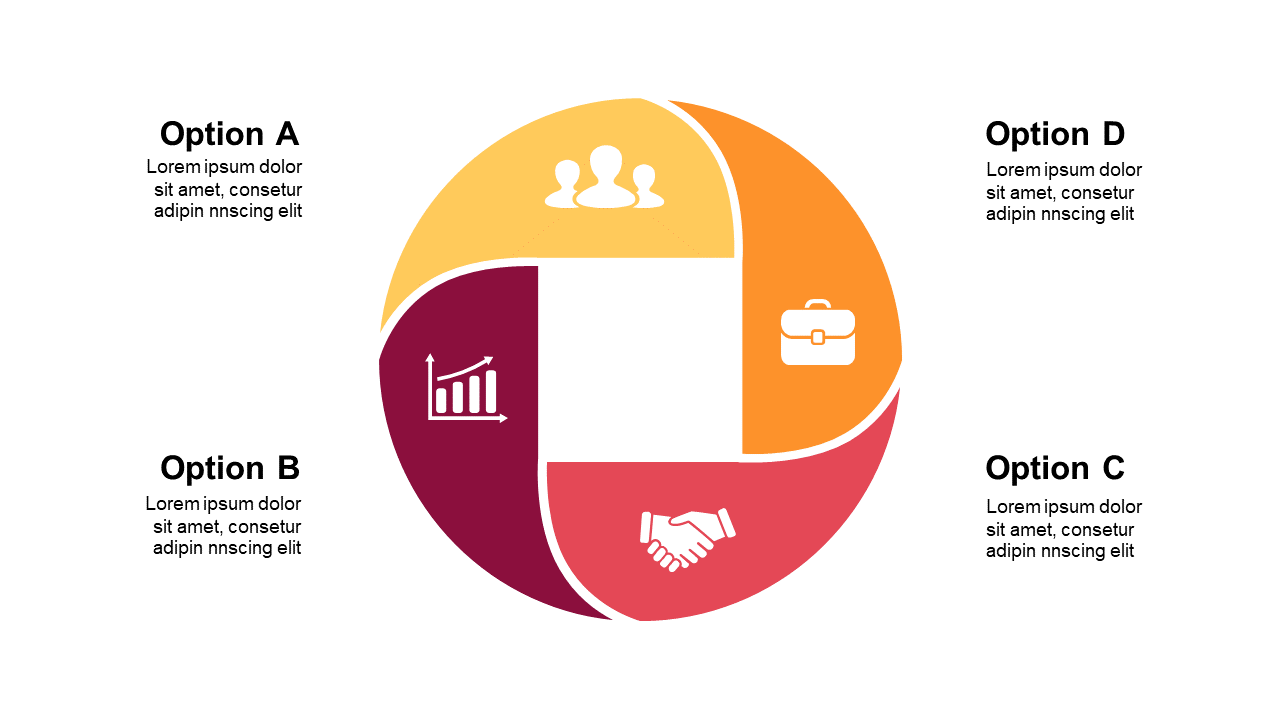
This circular 6-step diagram serves as a powerful visual tool to simplify that communication. As a strategy manager in finance or marketing, you might use this slide during quarterly business reviews or project kickoff meetings. It’s equally useful for trainers who need to explain training cycles distinctly to their teams, allowing for a clearer understanding of learning objectives.
Available for only $0.99, this slide is easy to download and customize in PowerPoint or Google Slides. You’ll be able to present your concepts quickly, making your preparation time minimal.
$0.99 – Purchase Checkout
Added to cart







