Visualize Steps with a Vertical Indicator Layout
Product Description
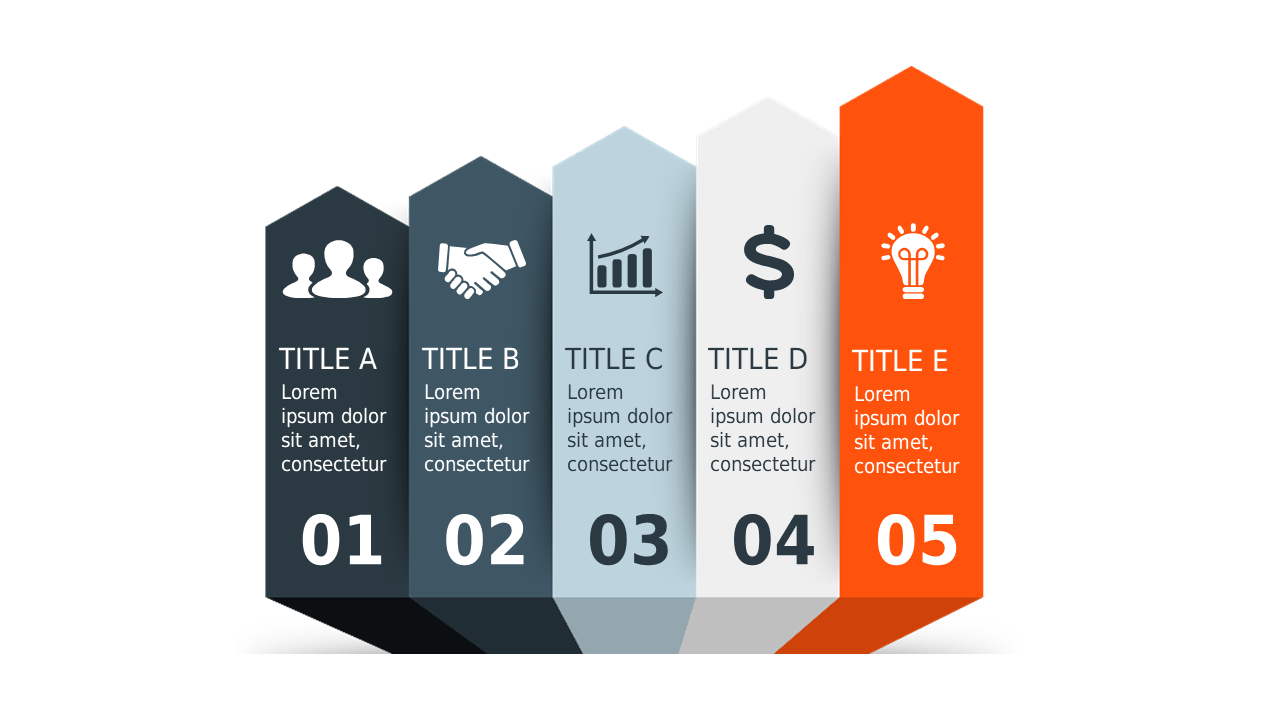
Articulating each step in a project can often lead to confusion or ambiguity, especially if the layout is cluttered. This slide’s vertical indicator layout provides a straightforward and clean way to illustrate the stages of your process, making it easy for your audience to follow along. The intuitive design includes icons that complement your text, enhancing overall comprehension.
Whether you’re a project coordinator laying out timelines or a sales manager presenting a sales funnel, this slide fits seamlessly into your presentations. It’s ideal for update meetings, training sessions, or even client pitches where clarity is essential.
You can focus on delivering your message without worrying about how your audience will understand it. For only $0.99, this slide is ready for immediate download and can be easily modified in PowerPoint or Google Slides. You’ll be equipped to present your process clearly and professionally in just minutes.
$0.99 – Purchase Checkout
Added to cart







