Six-Step Circular Process Diagram
Product Description
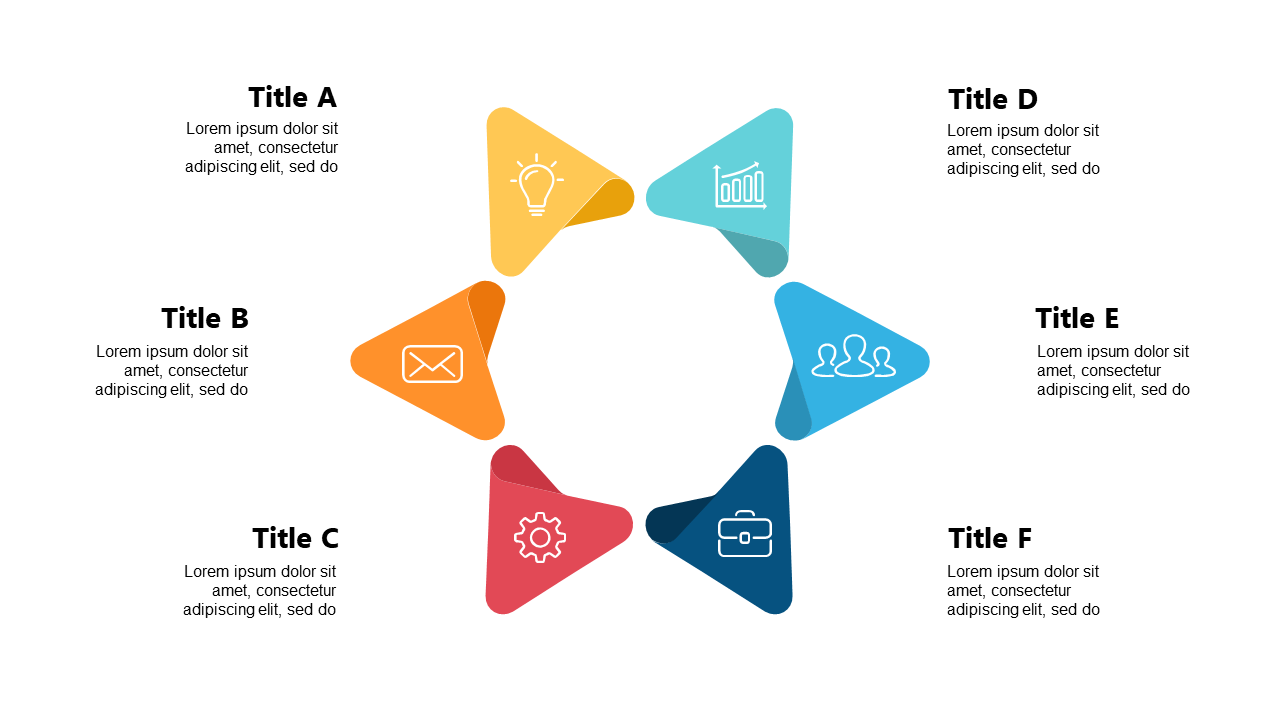
When you’re tasked with outlining a complex process or highlighting key concepts, keeping everything organized can be a challenge. Without a clear visual guide, your audience might not follow your points as you intend. This six-step circular process diagram simplifies your presentation by breaking down each area into easily digestible segments.
Business analysts and project coordinators will find this slide particularly useful during training sessions or discussions about operational frameworks. It’s also ideal for educators or workshop leaders needing to cover multiple concepts in a cohesive manner.
You can guide your audience through each segment, ensuring they understand the overall process. Available for only $0.99, this slide can be downloaded instantly and is editable in both PowerPoint and Google Slides. Make quick adjustments to the titles and descriptions, and you’ll be ready to present your content effectively in minutes.
$0.99 – Purchase Checkout
Added to cart