Map Stakeholder Relationships with Venn Diagram
Product Description
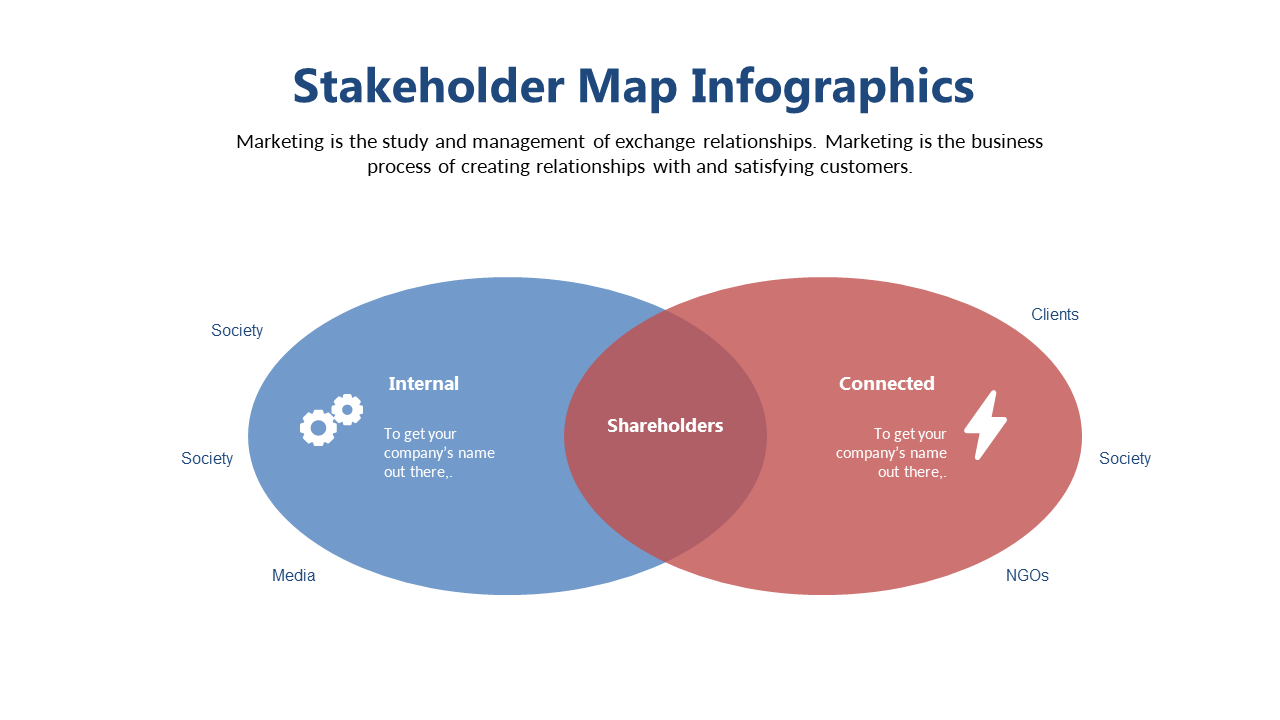
Conveying the nuances of stakeholder relationships can be a daunting task, especially when you’re trying to ensure everyone is on the same page. This Venn diagram slide simplifies those complexities, visually displaying how different groups like clients, shareholders, and the community intersect and affect each other.
Marketing strategists and business consultants will find this slide invaluable during strategic planning sessions or client briefings. It serves as a powerful tool to illustrate how targeted campaigns can impact various stakeholders, helping your team make informed decisions based on visual insights.
Available for just $0.99, this slide can be instantly downloaded and edited in both PowerPoint and Google Slides. You’ll find it easy to make any necessary adjustments, ensuring it seamlessly fits into your presentation style in just minutes.
$0.99 – Purchase Checkout
Added to cart







