Modern Watch Layout with Progress Bars for Marketing
Product Description
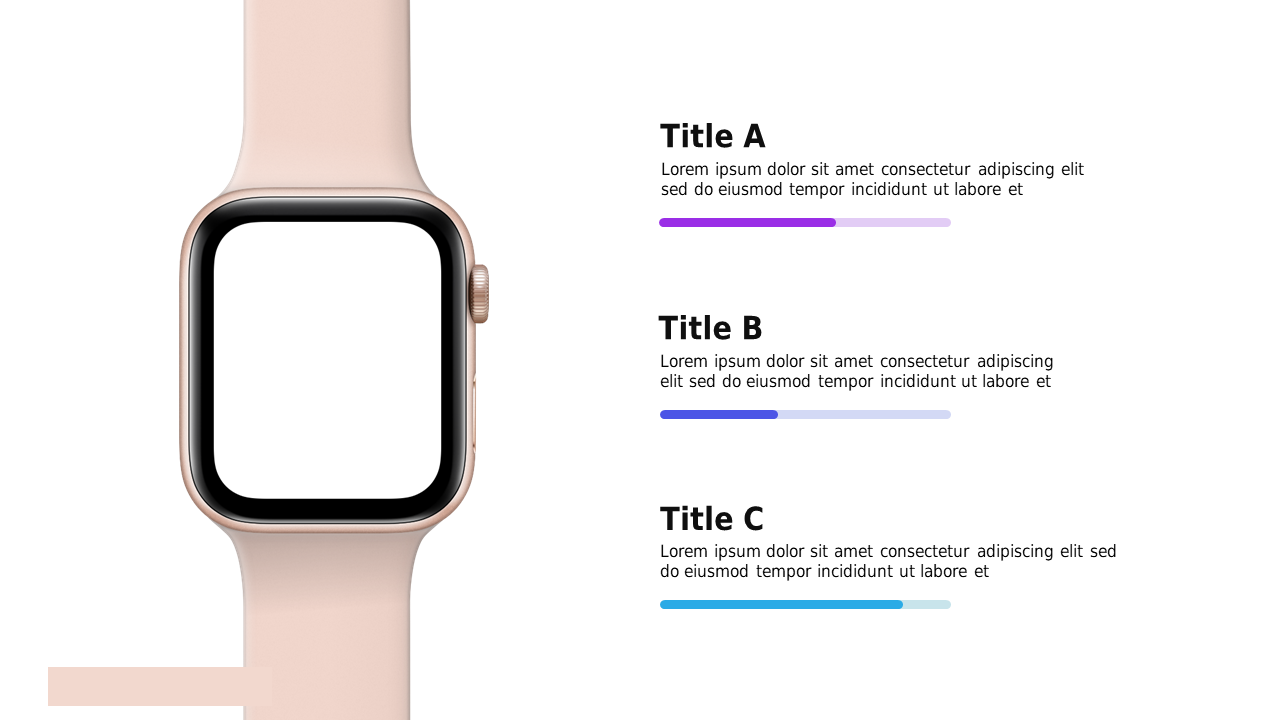
In a fast-paced marketing environment, it’s crucial to convey your progress and updates succinctly. This modern watch layout with progress bars is designed for marketers who need visuals that clearly communicate key metrics at a glance, so your audience can easily grasp the information.
This slide works wonders for marketing managers preparing campaign updates, product development teams showcasing progress on new features, or business analysts presenting performance data. It allows you to make a strong visual impact while ensuring that your metrics are front and center.
You can download this slide for just $0.99, and it’s ready for you to edit in PowerPoint and Google Slides. Customize it swiftly to fit your specific details and elevate your presentation in no time.
$0.99 – Purchase Checkout
Added to cart