Highlight Stakeholder Dynamics with Venn Diagram
Product Description
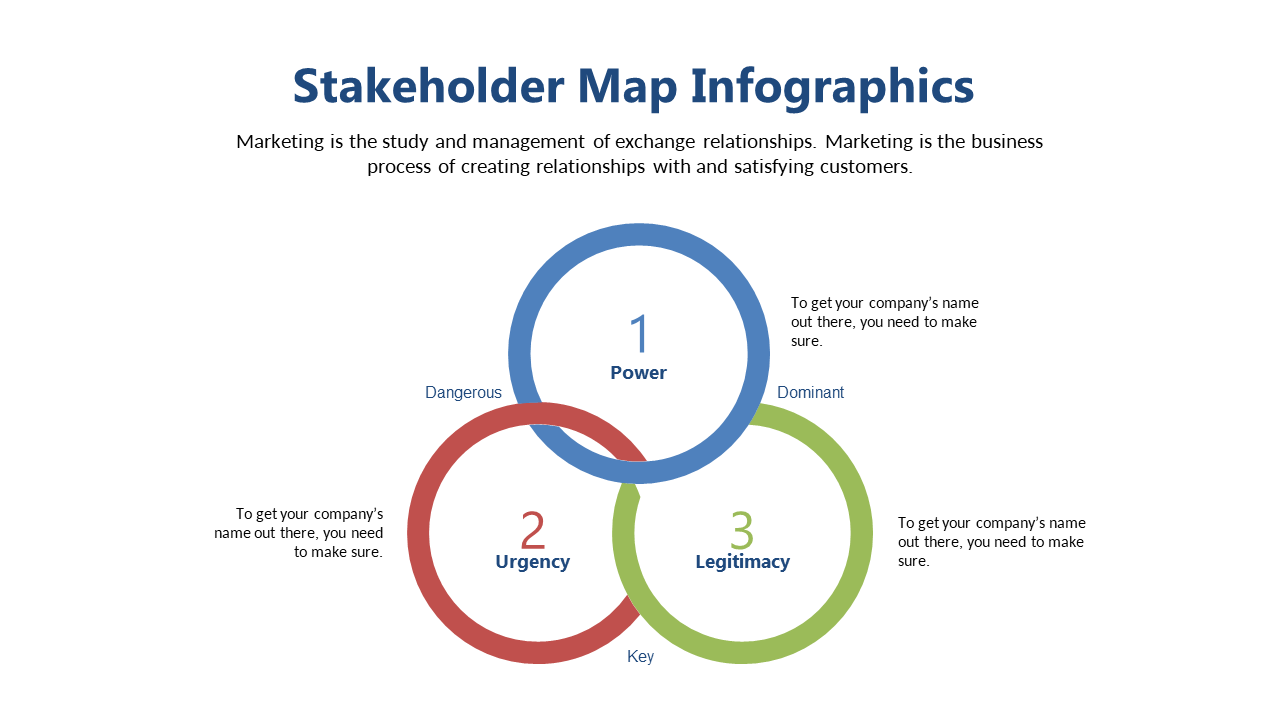
When trying to convey complex relationships among stakeholders, clarity is essential yet often hard to achieve. You want a visual that effectively communicates these dynamics without overwhelming your audience. This Venn diagram slide beautifully represents the interplay between different stakeholder categories, making it simple to understand.
This slide is perfect for marketing strategists, product managers, and consultants working on stakeholder mapping during team brainstorming sessions or client presentations. Imagine showcasing how different groups influence each other during a strategy refinement meeting, providing a clear visual reference for discussions.
At a price of only $0.99, you can download this slide immediately. It’s fully editable in both PowerPoint and Google Slides, ensuring
you can customize it to your needs quickly and effortlessly.
$0.99 – Purchase Checkout
Added to cart







