Analyze Market Pricing with Venn Diagram
Product Description
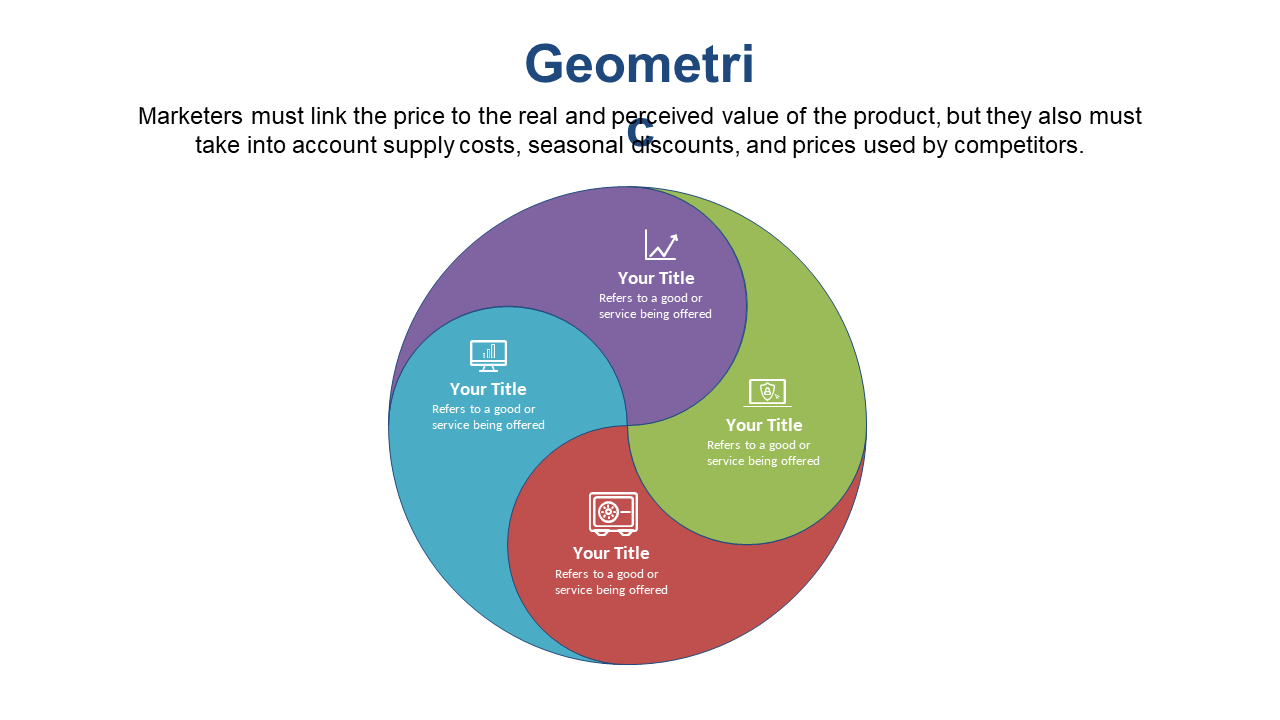
The challenge of conveying the intricate relationships in market pricing can often lead to misunderstandings during presentations. This Venn Diagram slide offers a straightforward method for depicting how value, cost, and competition overlap, making it easier for your audience to grasp the nuances of your analysis.
This slide is perfect for market analysts, business strategists, and financial consultants who need to present findings in board meetings or team strategy sessions. Whether you’re assessing pricing trends in the consumer goods sector or looking to illustrate competitive positioning in the tech industry, this visual tool adds clarity to your arguments.
At just $0.99, you can download this slide without delay, ready for immediate use. It’s fully editable in PowerPoint and Google Slides, so
you can customize it to fit your specific needs in no time.
$0.99 – Purchase Checkout
Added to cart