Showcase Key Data Points with Venn Diagram
Product Description
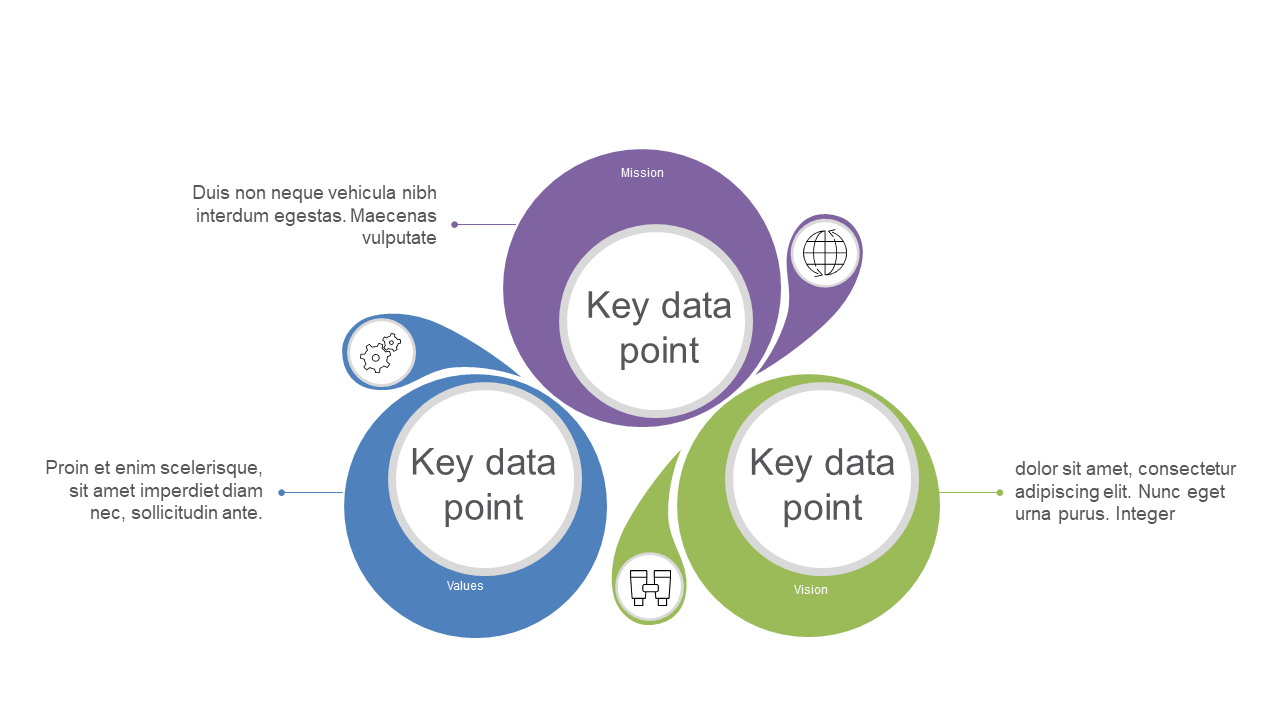
Connecting the dots between different concepts can be a challenge, especially when the information is critical to understanding your message. You need a clear way to illustrate how ideas relate to one another without overwhelming your audience. This Venn diagram offers a simple yet powerful visual structure to showcase those intersections, making your data easy to digest.
This slide works wonders for analysts and strategists who need to present relationships among core company values and objectives. It’s also ideal for educators discussing overlapping historical events or scientific principles.
If you’re in a workshop or meeting where clarity is essential, this diagram is your go-to tool. Available for just $0.99, you can download it instantly and start editing in PowerPoint or Google Slides. With a few quick adjustments, you’ll have a compelling visual ready for any audience, all within minutes.
$0.99 – Purchase Checkout
Added to cart







