Engage Audiences with Puzzle Piece Human Diagram
Product Description
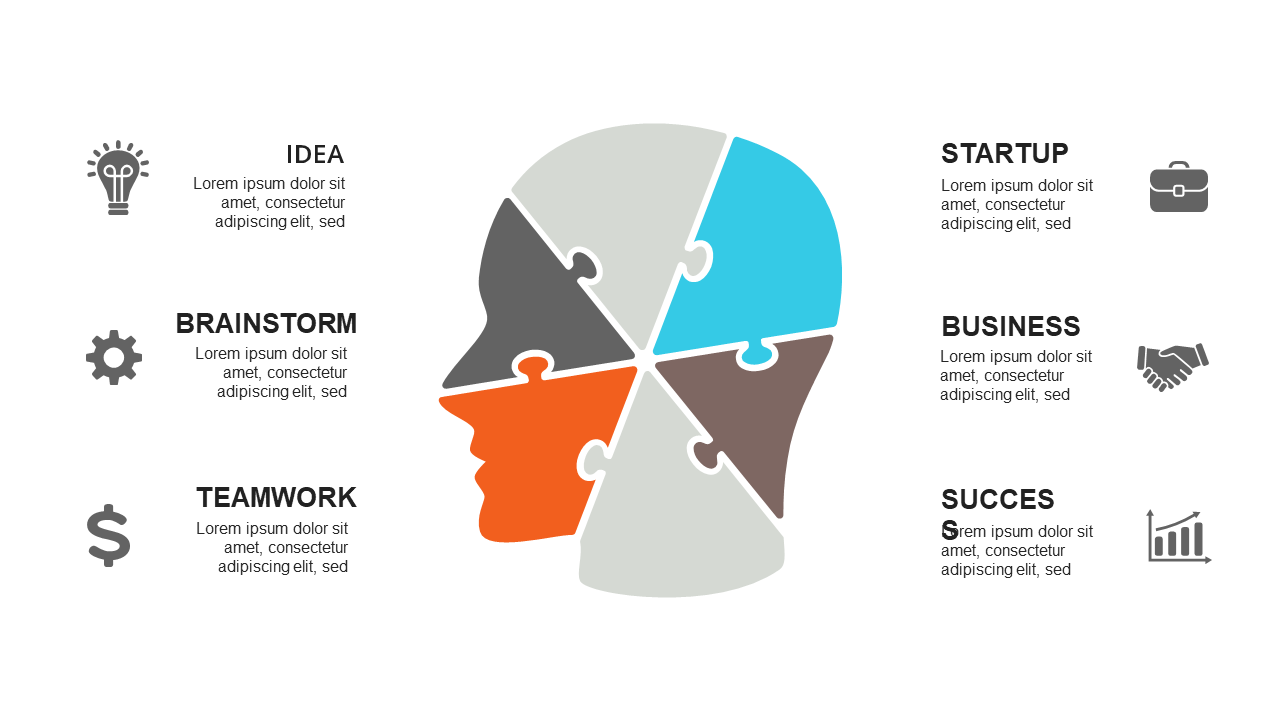
It can be tough to illustrate how various aspects of human behavior are interconnected, often leading to confusion among your audience. This puzzle piece human diagram allows you to break down those complexities visually, making your points more digestible and relatable.
This slide is particularly suited for psychologists presenting research findings, team coaches facilitating discussions, or educators explaining group dynamics. Whether in workshops or professional training sessions, it helps make your ideas resonate with your audience.
Available for only $0.99, this diagram is ready for instant download and can be easily customized in PowerPoint or Google Slides. Modify the elements to fit your narrative and have a refined presentation ready in minutes.
$0.99 – Purchase Checkout
Added to cart