Visualize Concepts with Venn Diagram and Map
Product Description
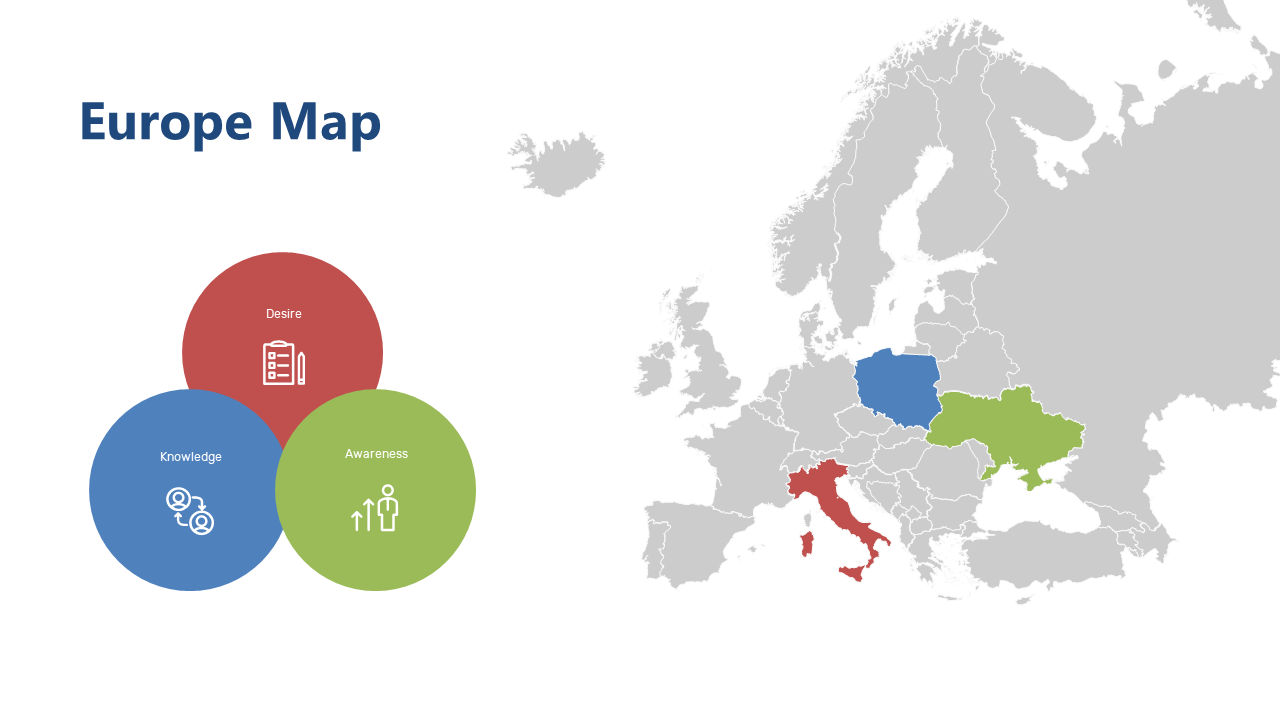
When it comes to conveying intricate relationships between concepts, especially in specific regions, many professionals find it hard to present their ideas clearly. This slide combines a Venn diagram with a detailed map of Europe, helping you visualize how different ideas intersect in a geographical context, making complex concepts more accessible.
This slide is an excellent tool for architects, urban planners, or project managers looking to illustrate spatial relationships and concepts during meetings or workshops. If you’re teaching or training, it can also serve as a helpful visual aid to engage your audience effectively.
For just $0.99, you can instantly download this slide, and it’s easily editable in PowerPoint or Google Slides. You’ll be able to adapt it quickly to suit your needs, ensuring you can present your ideas in a fresh and engaging way in minutes.
$0.99 – Purchase Checkout
Added to cart