Visualize Overlapping Concepts with Venn Diagram
Product Description
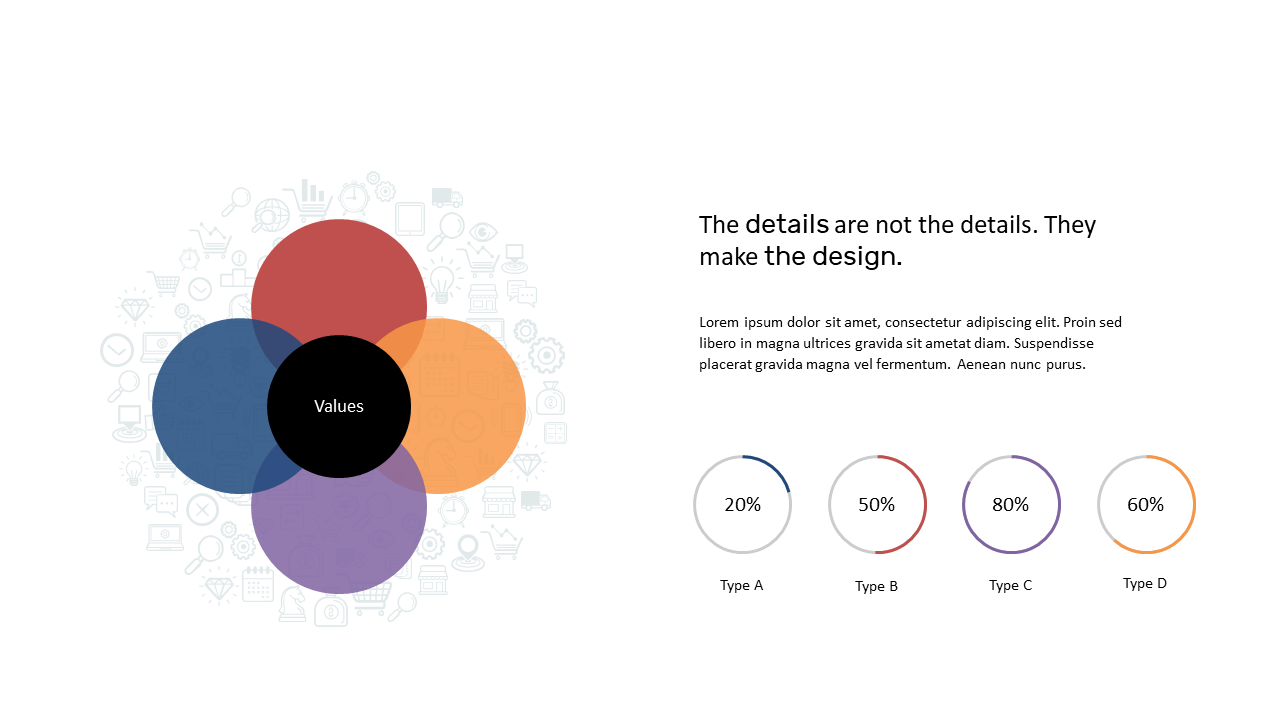
Presenting overlapping concepts can often lead to confusion, making it challenging to convey your key points effectively. This Venn diagram slide simplifies the complexity, allowing you to visualize relationships between data sets in a clear and straightforward manner.
The design draws attention directly to the core values that bind these concepts together. This slide is perfect for analysts and product managers, particularly during data review sessions or stakeholder presentations, where clarity in overlapping information is essential. You can also use it in educational contexts, where teaching complex ideas in a simplified way is critical.
For only $0.99, you can download this engaging slide immediately. It’s easily editable in PowerPoint and Google Slides, so you can tailor it to your presentation needs in just a few minutes.
$0.99 – Purchase Checkout
Added to cart