Visualize Customer Needs with Venn Diagram

Product Description
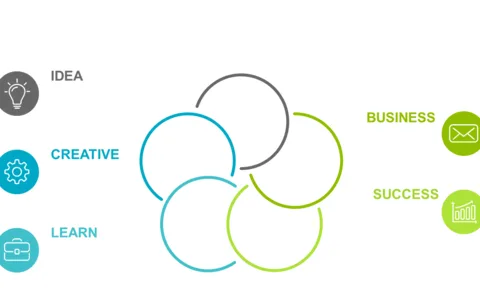
Communicating intricate ideas about customer needs can be a significant hurdle for strategy managers. This Venn diagram provides a straightforward visual that represents the intersection of customer needs, company capabilities, and competitive offerings, making complex information digestible for your team.
You can use this slide in team meetings, strategy sessions, or project updates where clear visualization of customer insights is crucial. It’s particularly suited for project managers, product developers, and marketing teams focused on aligning their objectives with customer desires.
For only $0.99, you can download this editable slide, ready for use in PowerPoint and Google Slides. Customize it easily to fit your specific context and share it with your team quickly.
$0.99 – Purchase Checkout
Added to cart