Illustrate Concepts with Colorful Venn Diagram V3
Product Description
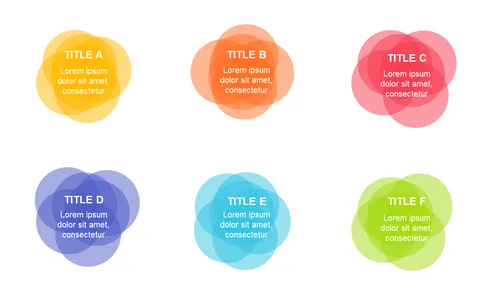
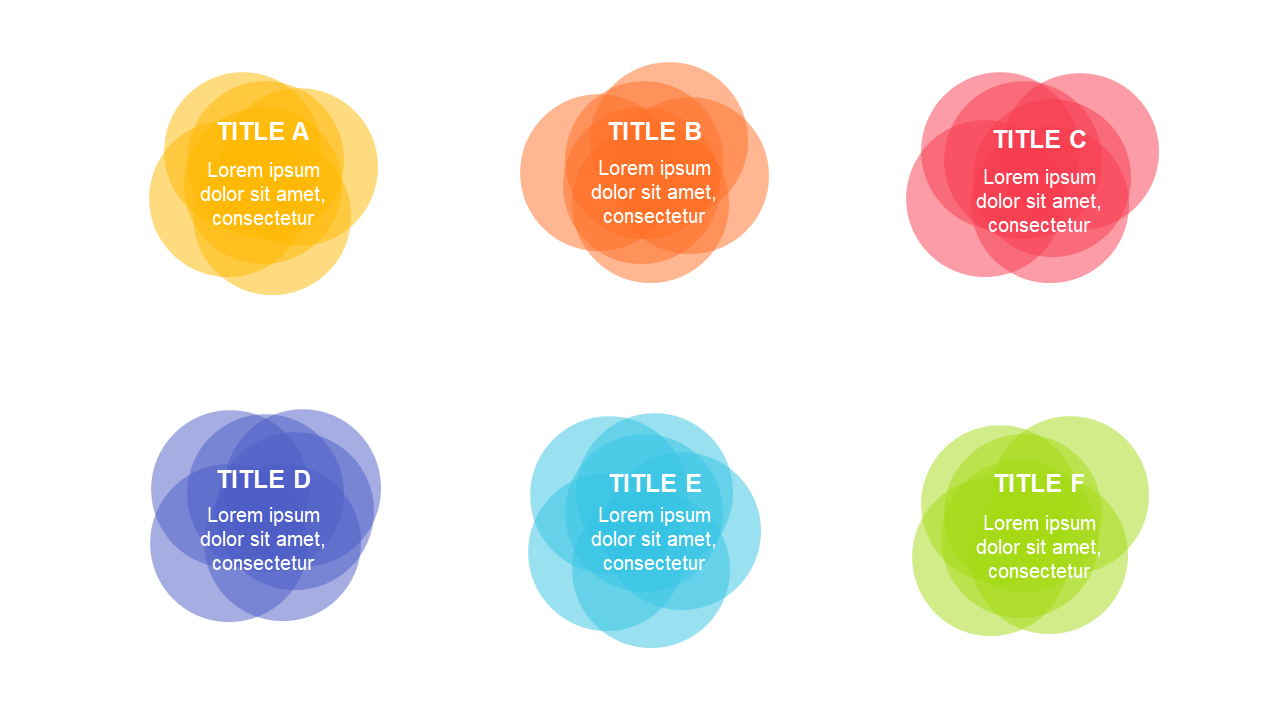
Communicating intricate data relationships often leads to confusion and disengagement. This colorful Venn diagram simplifies complex concepts, providing a clear and visually engaging way to showcase how different ideas connect with one another.
Perfect for data analysts working on reports or business analysts during presentations, this slide helps illustrate findings in a way that’s easy for your audience to follow. It’s also valuable for educators needing to explain overlapping theories to students in a compelling manner.
Download this slide for just $0.99, and enjoy the convenience of instant access to an easily customizable format. Whether you’re using PowerPoint or Google Slides, you’ll be ready to present your ideas effectively in no time.
$0.99 – Purchase Checkout
Added to cart