Analyze Customer Value Proposition with Venn Diagram
Product Description
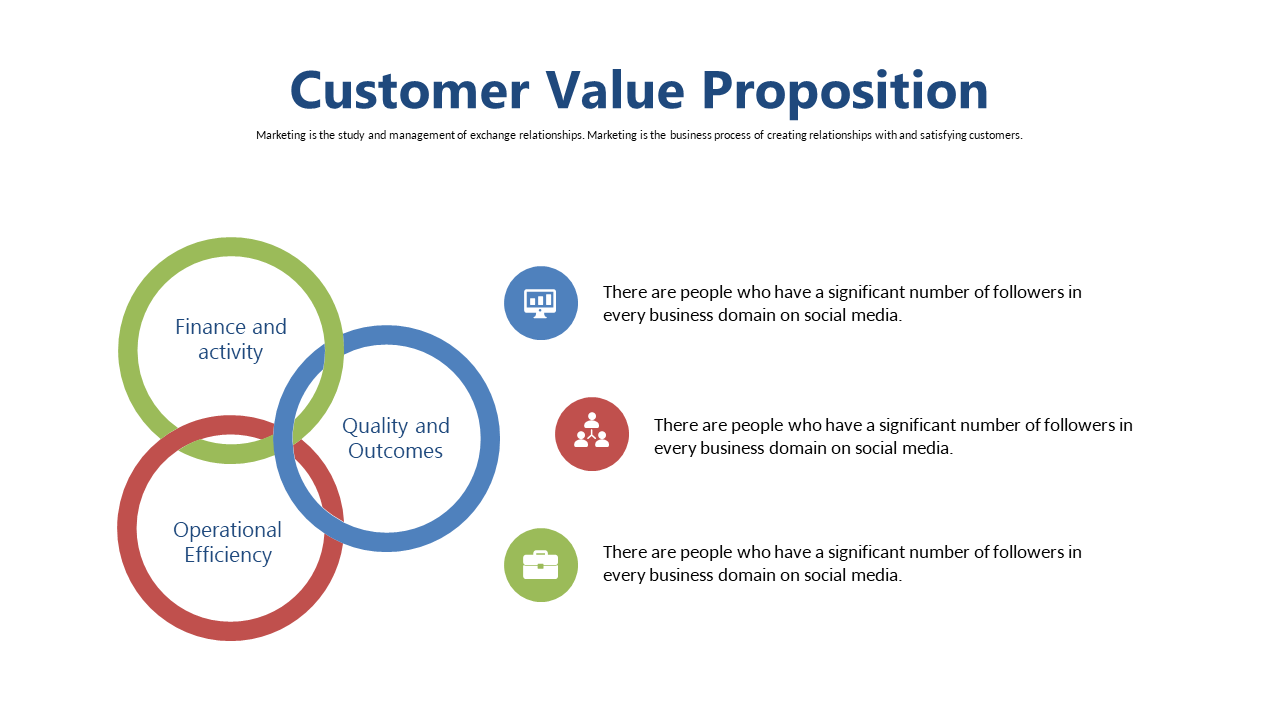
It can be overwhelming to navigate the nuances of customer value propositions, especially when you need to clarify what truly resonates with your audience. This Venn diagram gives you a clear visual aid that encapsulates the key elements like Finance, Quality, and Operational Efficiency, allowing you to convey complex ideas simply.
Market researchers, business analysts, and product managers will find this slide invaluable during presentations, focus group discussions, or strategy meetings. It helps bring clarity to discussions about what customers prioritize and how your offering aligns with those needs.
Download this slide for just $0.99; it’s fully editable in PowerPoint and Google Slides for your convenience. You can modify it in minutes to fit seamlessly into your existing presentation.
$0.99 – Purchase Checkout
Added to cart







