Showcase Business Relationships with Venn Diagram V2
Product Description
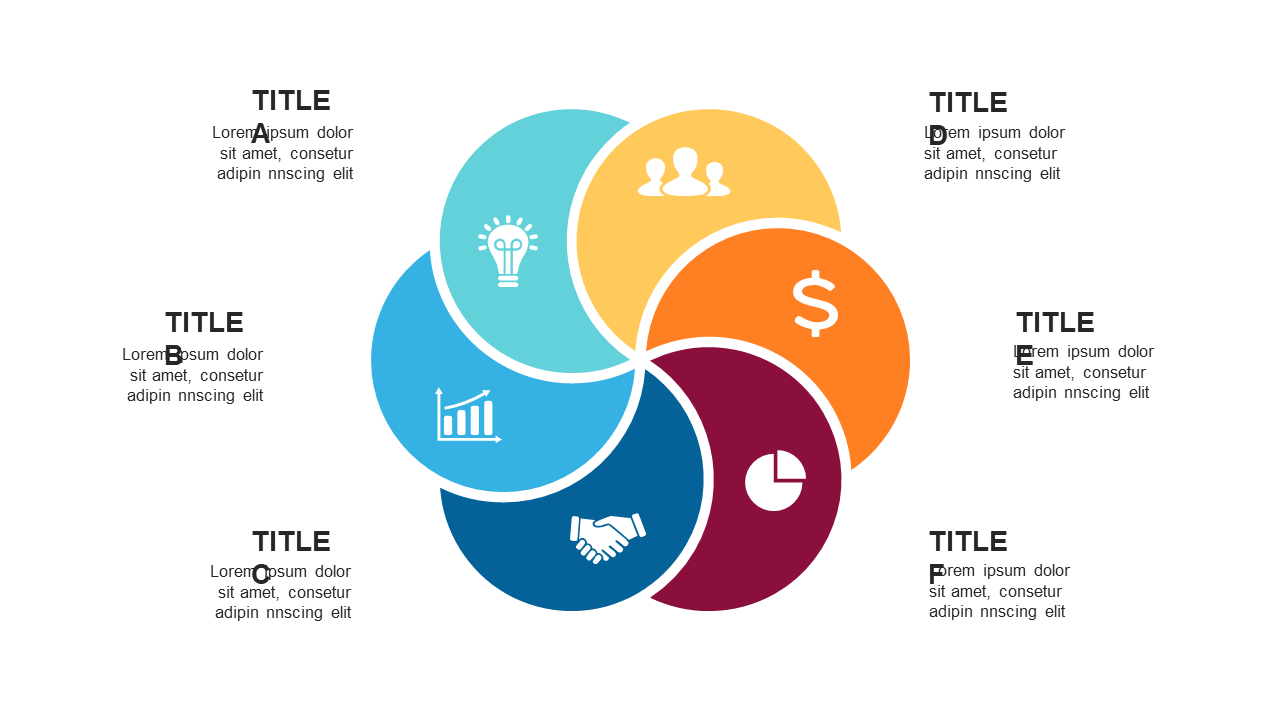
Communicating how different business concepts relate to each other can often lead to confusion, especially when all you have are words. A Venn diagram provides a visual framework that clearly shows the intersections of these ideas, making your point easier to understand.
This slide is perfect for startup founders illustrating their vision or marketing teams showcasing strategic overlaps. If you’re in a role where connecting different business themes is crucial, this diagram makes it straightforward and visually appealing for your audience.
For just $0.99, you can download this slide instantly and start editing right away. It’s compatible with both PowerPoint and Google Slides, ensuring that
you can easily customize it to match your specific content and style in just minutes.
$0.99 – Purchase Checkout
Added to cart