Illustrate Business Concepts with Venn Diagram
Product Description
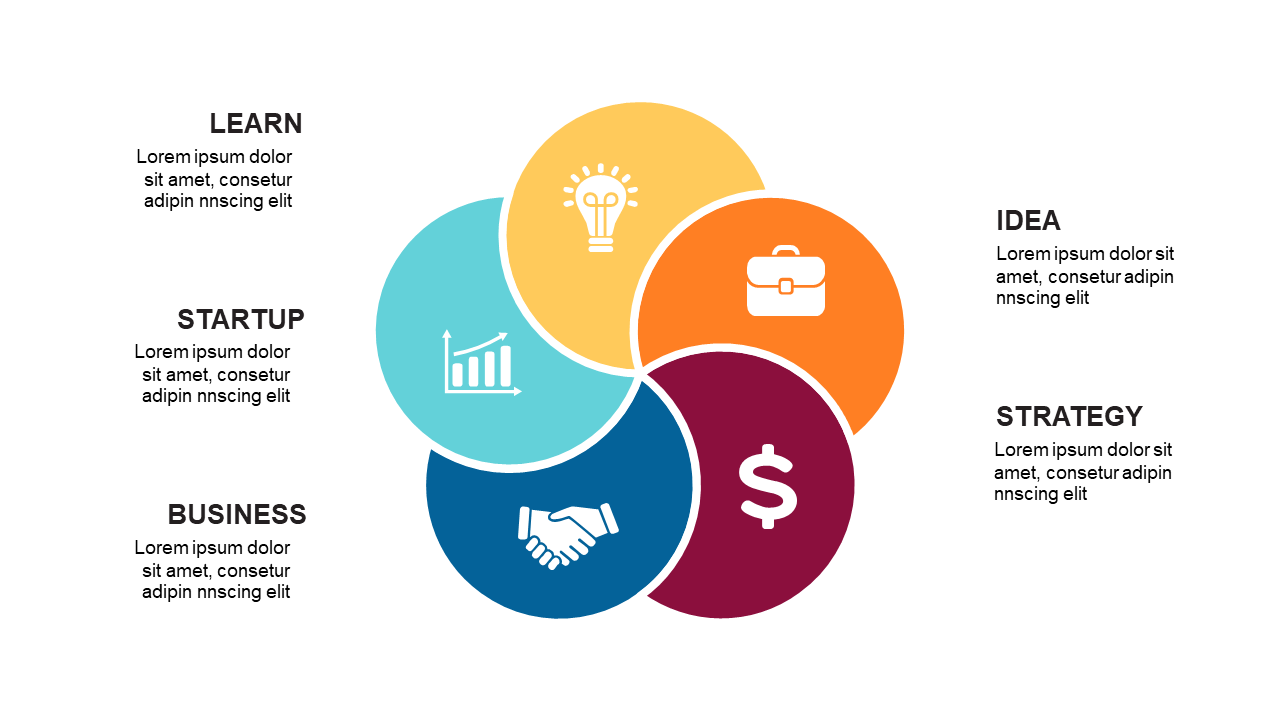
Explaining the relationship between multiple business concepts can be confusing, particularly when trying to connect various themes without a visual aid. A Venn diagram effectively illustrates how these ideas interrelate, transforming your presentation from mere words into a compelling visual.
This slide is particularly beneficial for business strategists outlining key themes or educators teaching entrepreneurship concepts. If you’re facilitating workshops or strategy discussions, you’ll find that this visual tool helps engage your audience and makes abstract concepts much more tangible.
Available for just $0.99, this slide is ready for an immediate download and easy to edit.
You can customize it in PowerPoint or Google Slides with ease, allowing you to adapt it quickly to your presentation needs.
$0.99 – Purchase Checkout
Added to cart