Conduct Value Chain Analysis with Detailed Sections

Product Description
Navigating the complexities of value chain analysis can be overwhelming without a clear structure. You need a way to break down your data into manageable parts that tell a coherent story.
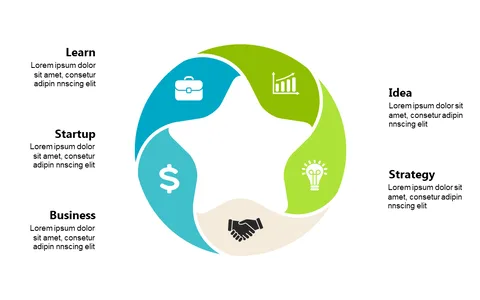
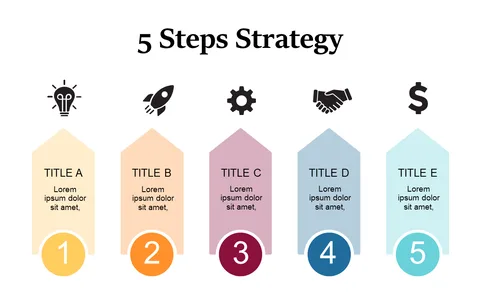
This slide provides a focused layout designed specifically for conducting a value chain analysis, helping you visualize each component clearly. Ideal for business analysts, strategic planners, and consultants, this slide works well during strategy meetings, growth assessments, or project evaluations. Use it to present insights about operations, logistics, and customer service, making it easy for stakeholders to grasp the connectedness of each segment.
Download this detailed slide for just $0.99 and start customizing it to fit your analysis. It’s ready for immediate use in PowerPoint and Google Slides, allowing you to present your findings with clarity in no time.
$0.99 – Purchase Checkout
Added to cart