Iceberg Model for Business Insights
Product Description
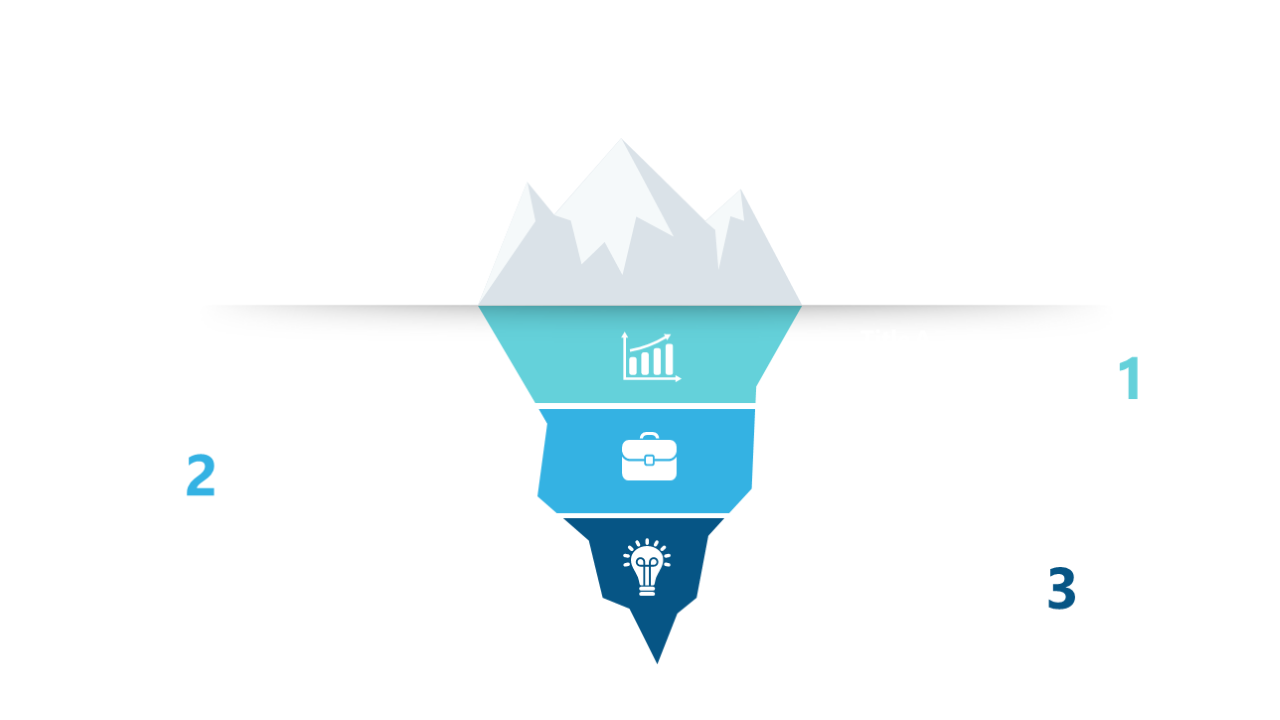
In a rapidly changing business landscape, understanding the underlying factors behind visible outcomes is essential. This iceberg model slide visually represents those layers of insight, helping to clarify how various elements contribute to your business strategy.
You can use this slide effectively in strategy sessions, team workshops, or client discussions to engage executives, strategists, and analysts in a deeper conversation about performance and insights. It’s a powerful tool for making complex information more accessible and actionable.
For only $0.99, this slide is ready for instant download and can be easily edited in PowerPoint or Google Slides. Personalize it quickly to reflect your brand and insights, making it a valuable addition to your presentation toolkit.
$0.99 – Purchase Checkout
Added to cart