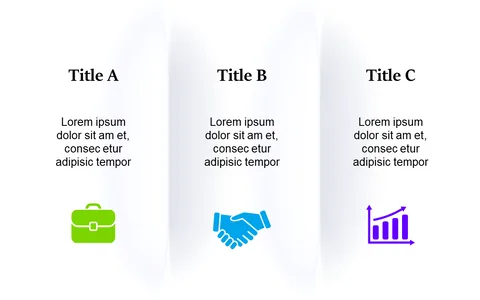
Visualize Value Chain Analysis with Segment Blocks

Product Description
When it comes to value chain analysis, clarity is crucial for effective communication. Without a clear way to present your data, you risk losing your audience’s attention or leaving them confused.
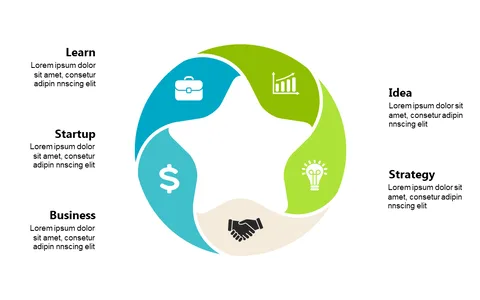
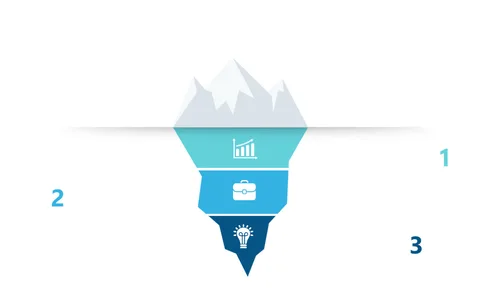
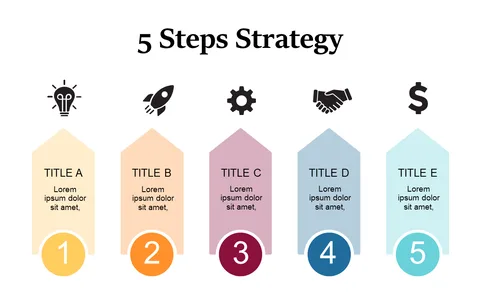
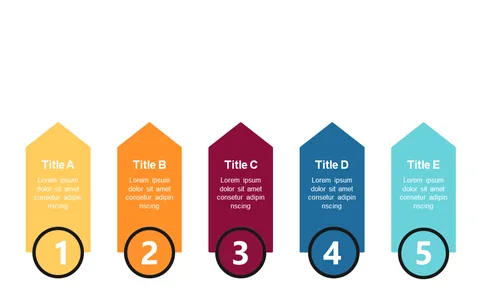
This slide offers an organized layout with segment blocks that simplify complex information and highlight your key components. This slide is perfect for business strategists, project leaders, and market analysts. Whether you’re in a strategy workshop, presenting to senior management, or conducting a performance review, this visual tool can help elucidate critical processes without overwhelming your audience with information.
For only $0.99, you can download this engaging slide and start customizing it right away. It’s designed for easy editing in PowerPoint and Google Slides, making it a breeze to adapt to your specific analysis needs.
$0.99 – Purchase Checkout
Added to cart