Represent Operational Phases in Value Chain Analysis
Product Description
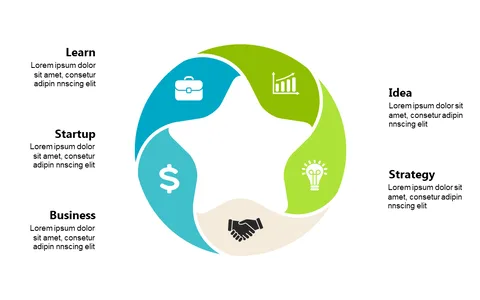
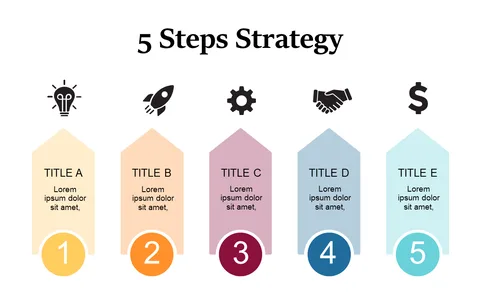
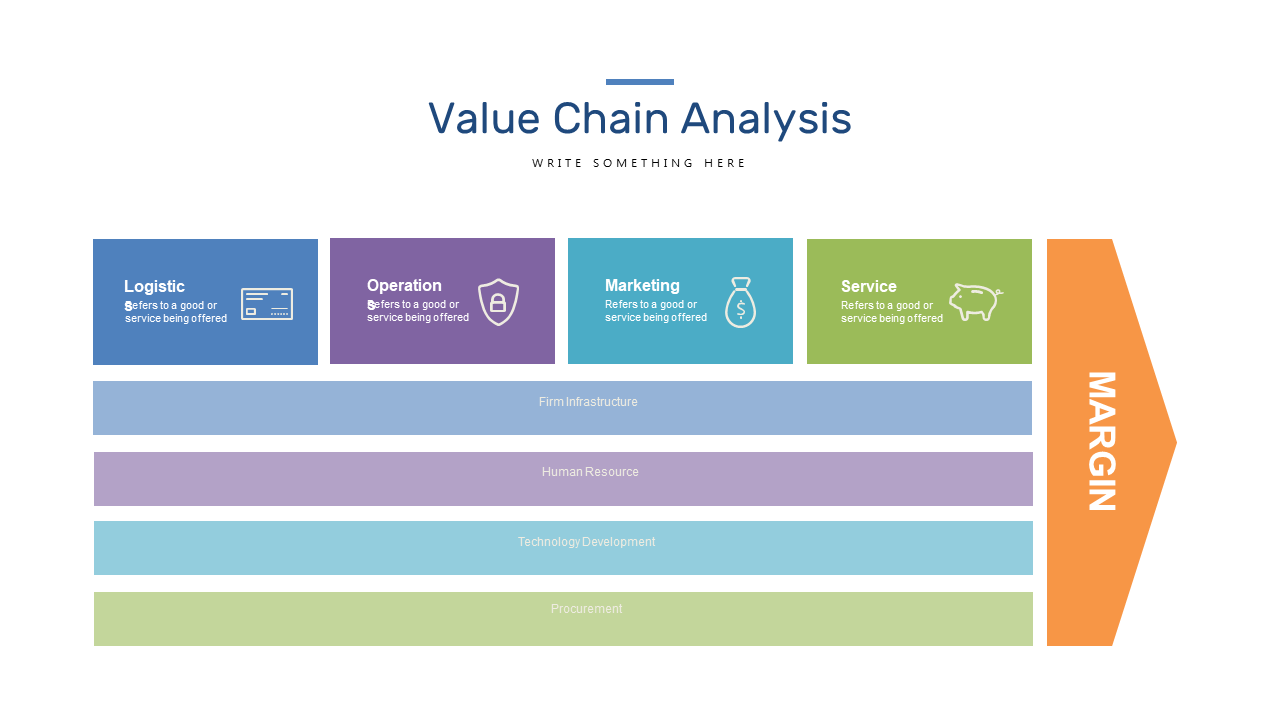
Conveying the various operational phases in value chain analysis can be a daunting task, especially when the details are intricate. You need a visual tool that simplifies this complexity and highlights the critical areas that drive business success. This slide provides a clear breakdown of logistics, operations, marketing, and services, making your message more accessible.
Business analysts working on process improvements can leverage this slide to showcase the operational phases during team meetings. It’s also great for project managers discussing project timelines in the context of value creation or marketing professionals presenting their strategies to stakeholders.
The clarity it brings makes it an essential asset for anyone needing to communicate complex business processes. At just $0.99, this slide is available for instant download and can be easily edited in PowerPoint or Google Slides. You’ll spend minimal time setting it up, allowing you to focus on your presentation content rather than the design.
$0.99 – Purchase Checkout
Added to cart