Visualize Operational Phases in Value Chain Analysis

Product Description
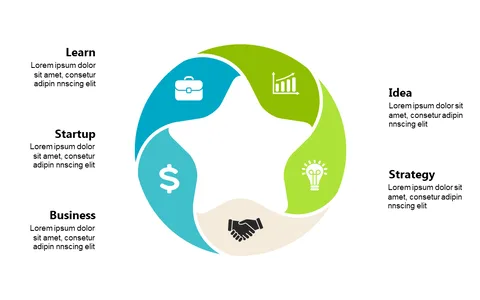
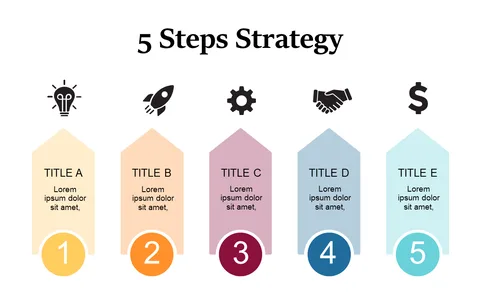
When you’re faced with the challenge of presenting complex strategies, you need visuals that enhance clarity rather than complicate your message. This slide effectively breaks down operational phases in value chain analysis, providing a structured visual representation of logistics, operations, marketing, and service. Each section is distinctly defined, which helps your audience to follow along easily.
This slide is perfect for strategic planners in tech companies looking to communicate how various phases of their operations interconnect. Additionally, sales managers can use it during quarterly reviews to illustrate how their efforts fit into the greater value chain. Any professional tasked with presenting operational strategies will benefit from its clear layout.
For only $0.99, you can download this slide and get to work in PowerPoint or Google Slides within minutes. It’s designed for easy editing, so
you can customize it to fit your specific narrative without any hassle.
$0.99 – Purchase Checkout
Added to cart