Evaluate Value Chain with Margin Indicators
Product Description
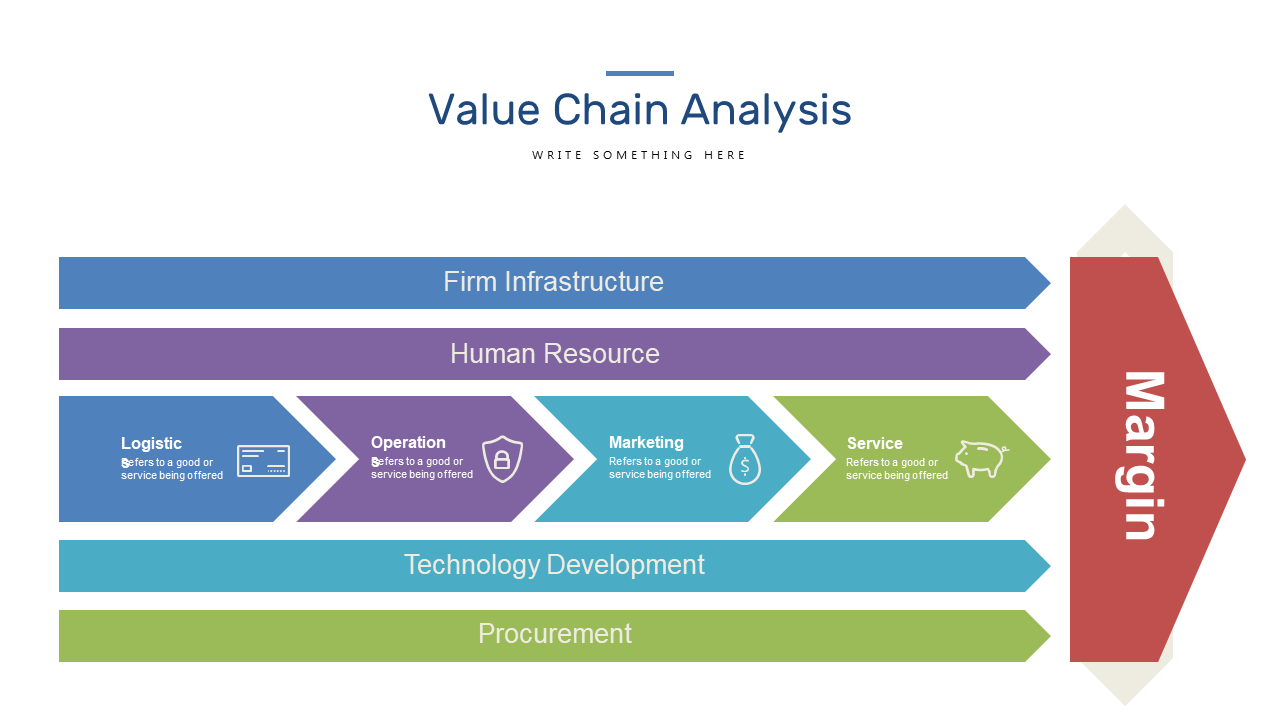
Articulating the profitability of your business segments can be a daunting task, especially when you need to do it quickly for stakeholders. This slide helps you visually represent margin indicators along the value chain, making it easier to communicate where your organization is thriving and where there might be room for improvement.
It’s perfect for strategy consultants working with various clients, finance managers presenting quarterly reviews, or project leads who need to demonstrate the financial health of different operational areas. Whether you’re in a boardroom meeting or conducting a client workshop, this slide allows you to convey critical financial insights effectively.
At just $0.99, you can easily download this slide and edit it right in PowerPoint or Google Slides within minutes. Make it your own and get ready to impress your audience with clear, professional visuals.
$0.99 – Purchase Checkout
Added to cart