Upward Arrow Icons for Business Metrics

Product Description
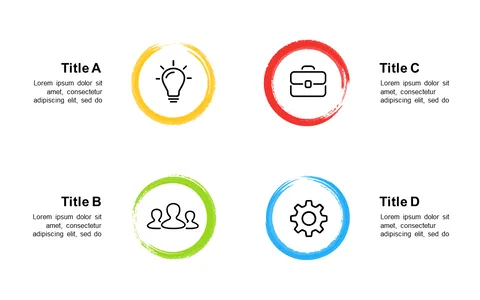
Breaking through the clutter of data presentation is vital, and metrics are a key component of any business strategy. If you’ve been struggling to present your numbers effectively, this slide with upward arrow icons can help you cut through the noise.
It provides a clean, professional look that showcases your business and growth metrics clearly. Perfect for data analysts, financial officers, or business strategists, this slide works well in performance reviews, investment pitches, or operational updates. It allows you to communicate your metrics in a way that captures attention and invites discussion.
Available for just $0.99, you can quickly download this slide and start editing right away in PowerPoint or Google Slides. With its intuitive design, you can easily tailor it to fit your specific data points and insights.
$0.99 – Purchase Checkout
Added to cart