Business Growth Icons with Upward Arrows

Product Description
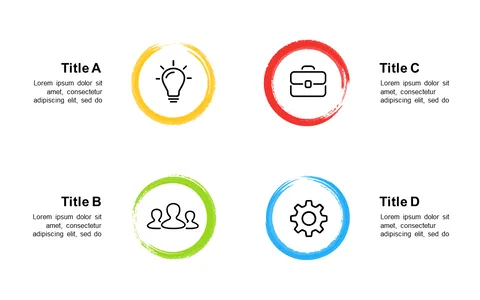
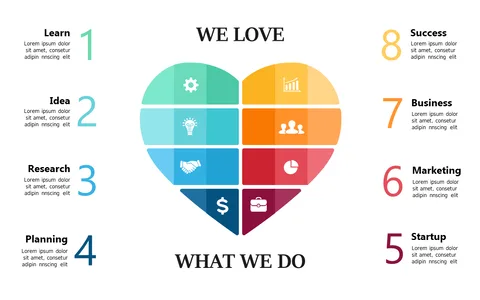
When it’s time to convey success and improvement, the right visuals can make a significant difference in your presentation. This slide showcases upward arrows alongside icons representing various aspects of business growth, giving you an engaging way to present your data.
It’s designed to illustrate your progress in a compelling manner. This slide is an excellent fit for business analysts, growth strategists, or operations managers preparing for performance reviews, team meetings, or client discussions. You’ll find that this layout not only enhances your message but also captivates your audience’s attention effectively.
For only $0.99, this slide is ready for instant download and is easily editable in both PowerPoint and Google Slides. You’ll have everything you need to make your growth story clear and impactful in just a few minutes.
$0.99 – Purchase Checkout
Added to cart