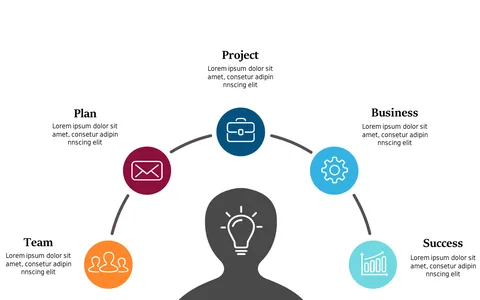
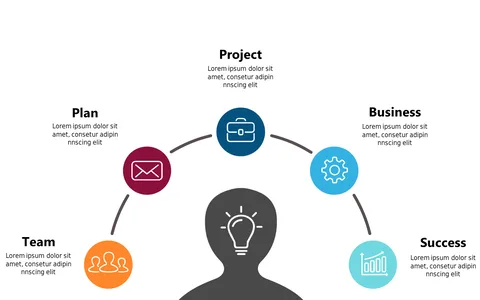
Track Project Milestones with Circular Timeline
Product Description
Tracking project milestones can be a tricky endeavor, especially when you need to convey complex timelines clearly. It’s easy for important dates to get lost in text-heavy slides.
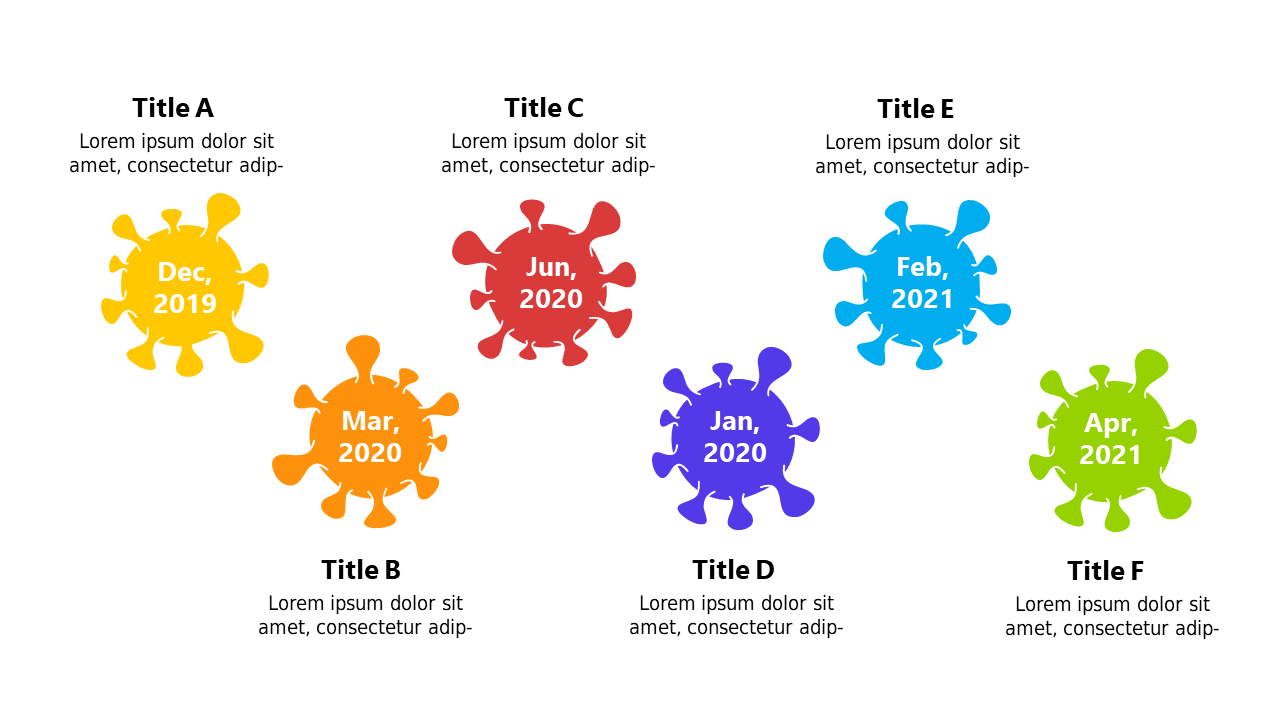
This circular timeline slide presents key milestones in an engaging format, ensuring that your audience can easily follow along. Team leads, project managers, and coordinators can make great use of this slide in status meetings, project briefings, or updates. It helps in illustrating progress in a visually appealing manner, which keeps team members informed and motivated as they see how each milestone fits into the larger project.
You can get this slide for just $0.99, instantly downloadable and easily editable in both PowerPoint and Google Slides. Tailor it to your project needs quickly, allowing you to focus on guiding your team’s success.
$0.99 – Purchase Checkout
Added to cart